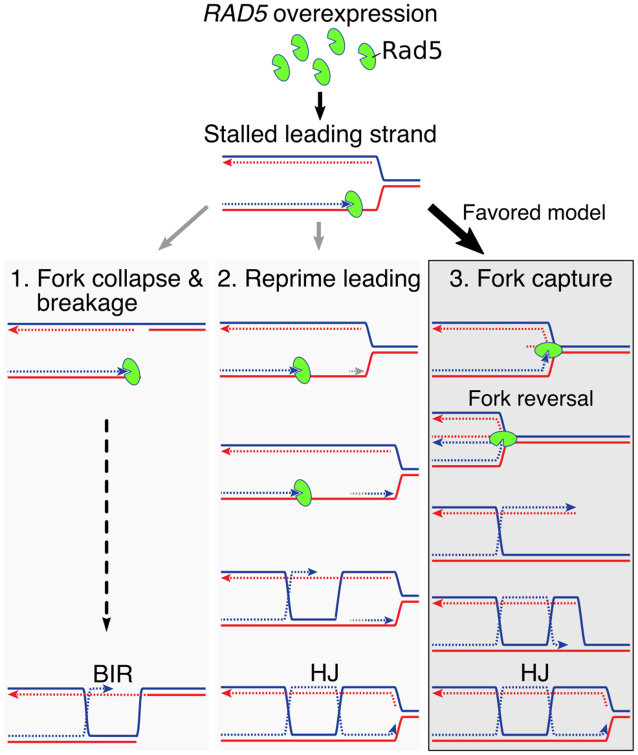
Figure 6.
Models for excess Rad5 at a replication fork. A replication fork is shown with blue and red solid lines representing the parental strands. Nascent DNA is represented as dashed lines, and arrowheads indicate the direction of DNA polymerization. Rad5 (green oval) is shown binding to the 3′ end of the leading strand via the HIRAN domain (cleft in the oval). See text of Discussion section for description of the models.

