Figure 1.

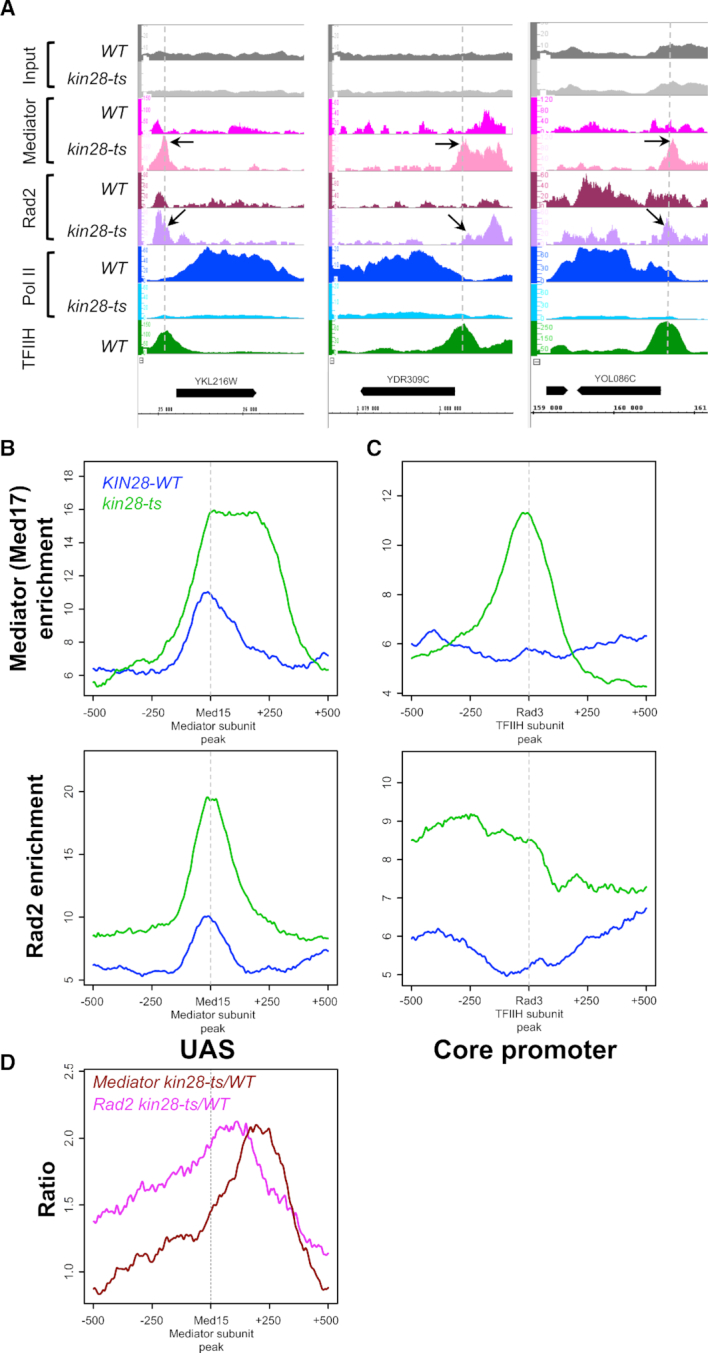
Effects of kin28-ts mutation on genome-wide Mediator and Rad2 occupancy. (A) Examples of ChIP-seq tag density profile of Mediator (Med17), Rad2, Pol II (Rpb1) and TFIIH (Rad3) in WT and kin28-ts context following a 75-min shift from 25°C to 37°C. ChIP-seq was done on the chromatin from exponentially growing yeasts expressing tagged versions of Med17 (Myc) and Rad2 (HA) in WT or kin28-ts context. Mapped reads were extended to 150 bp, and the number of reads for each position of the genome was counted to determine tag density. Densities were scaled per millions reads, and normalization step was performed as described in ‘Materials and Methods’ section. Alignment of Med17 Mediator peaks present in kin28-ts mutant, and low or absent in WT strain, with Rad3 TFIIH peaks in core promoter regions is indicated by the vertical dashed lines. The black arrows point to the increase of Mediator on core promoter regions and increase of Rad2 on UAS and core promoter regions. (B andC) Average tag density in Med17 Mediator ChIP (upper panel) and Rad2 ChIP (lower panel), around Med15 Mediator peaks (B, UAS, 1000 bp window) and Rad3 TFIIH peaks (C, Core promoter, 1000 bp window). Average tag density in WT strains is indicated in blue, whereas average tag density in kin28-ts strains is indicated in green. (D) Mediator (in brown) and Rad2 (in pink) occupancy ratio between kin28-ts mutant and the WT around Med15 Mediator peaks (UAS, 1000 bp window). The maximum of the Rad2 occupancy ratios is located between UAS and the maximum for Mediator occupancy ratios.
