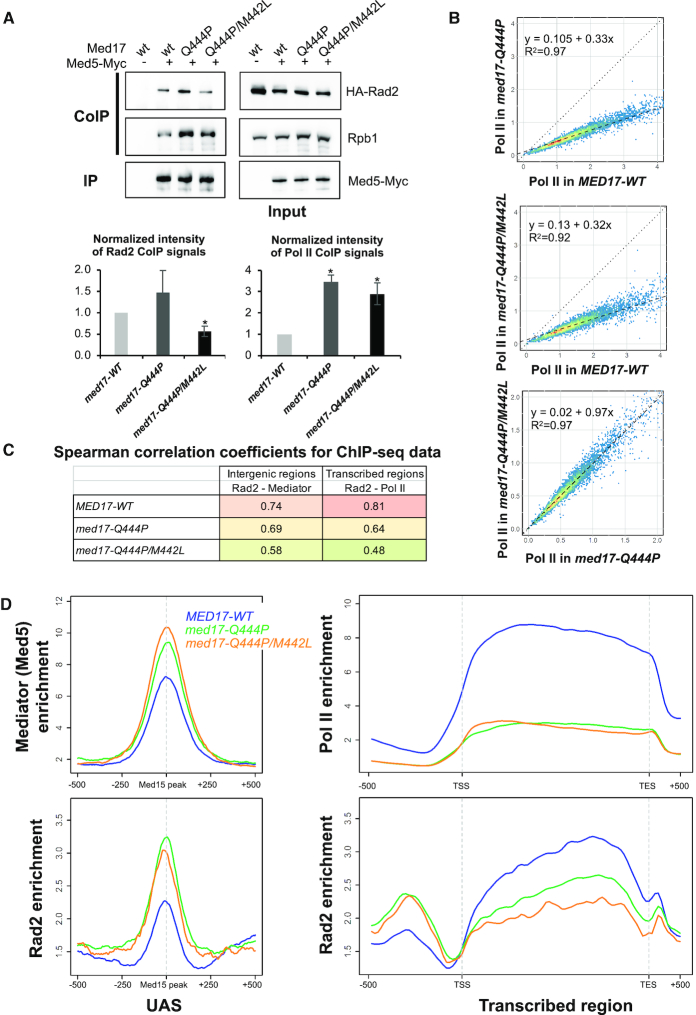
Figure 4.
Effects of med17 mutations on Mediator interactions with Rad2 and Pol II and on genome-wide Mediator, Rad2 and Pol II occupancy. (A) Western blot analysis of Mediator interaction with Rad2 and Pol II in standard growth conditions. Crude extracts were prepared from yeasts expressing tagged (+) or untagged (−) versions of Med5 (Myc) in MED17-wt, med17-Q444P or med17-Q444P/M442L context in exponential phase and samples were immunoprecipitated with α-Myc antibody (IP Myc). Immunoprecipitates and Inputs were analysed by western blotting with α-Myc, α-HA and α-Rpb1 antibodies. The intensity of immune staining for coimmunoprecipitated Rad2 or Pol II signals relative to the WT was normalized against immunoprecipitation signals and is displayed in the bottom panels. The mean values and standard deviation (indicated by error bars) of four independent experiments are shown. The asterisk represents a significant difference between the WT and the mutant at P-value < 0.05 in a Student's t-test. The Rad2 CoIP signal in med17-M442L/Q444P mutant was also significantly different from med17-Q444P. (B) The tag densities in the Pol II ChIP-seq experiments were calculated for the Pol II-transcribed mRNA genes. Tag densities were normalized relative to qPCR data on a set of selected genes. Each point on the plot corresponds to one transcribed region. A linear regression (dotted line) for ChIP-seq density in the med17-Q444P or med17-Q444P/M442L mutant versus ChIP-seq density in WT or in med17-Q444P versus med17-Q444P/M442L and an R2 linear regression coefficient are indicated. The dashed line corresponds to y = x. (C) Pair-wise SCC of ChIP-seq data between med17 mutants and WT were calculated for Rad2 and Mediator on intergenic regions (left column, intergenic regions for Pol II-transcribed genes in tandem or in divergent orientation, excluding intergenic regions encompassing Pol III-transcribed genes) or for Rad2 and Pol II on transcribed regions (right column). The colours correspond to the scale for SCC indicated in Supplementary Figures S9 and 10. (D) Average tag density in Med5 Mediator ChIP (upper left panel), Rad2 ChIP (lower panels) and Rpb1 Pol II ChIP (upper right panel), around Med15 peaks corresponding to UAS (left panels, 1000 bp window), and on transcribed regions of 10% Pol II most-enriched genes (right panels, scaled windows for 500 bp before TSS, between TSS and TES, and 500 bp after TES). Average tag density in WT, med17-Q444P and med17-Q444P/M442L strains is indicated in blue, green and orange, respectively.

