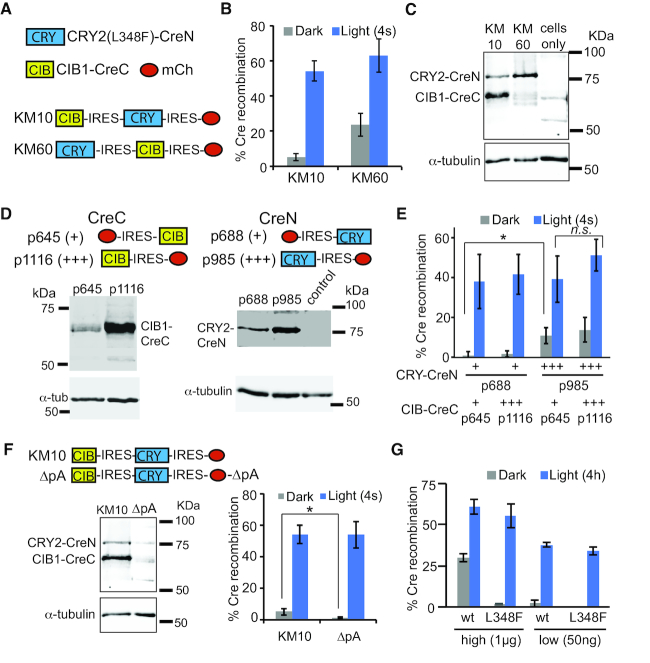
Figure 1.
Alteration of expression level of CRY2-CreN and CIB1-CreC fragments causes changes in dark background, with minimal effects on light-induced activity. (A) Schematic showing combined constructs used in (B) and (C). (B) Quantification of Cre recombinase activity in HEK293T cells. Cells expressing CRY2(L348F)-CreN in front of an IRES element (KM60) show higher dark background compared with KM10. Cells were transfected with indicated plasmids and a loxP-STOP-loxP-EGFP reporter, then kept in dark and harvested at 48 h. Light-treated samples were exposed to a 4 s pulse of light at 24 h. Graph shows average and error (s.d., n = 4–6 independent experiments). (C) Immunoblot comparing expression of Cre fragments in KM10 versus KM60 (anti-Cre antibody, top panel; anti-tubulin, bottom panel). (D) Immunoblots of dual plasmid system. HEK293 cells were transfected with indicated constructs and immunoblotted with an anti-Cre antibody (top). Bottom panel shows anti-tubulin loading control. Control lane consisted of non-transfected cells. (E) Quantification of Cre recombinase activity in HEK293T cells transfected with indicated constructs and light-treated as in (B). Protein expression level as determined in (D) is indicated below the graph, with ‘+’ (low expression) or ‘+++’ (high expression). Graph shows average and error (s.d., n = 3–5 independent experiments). (ns, not significant; *, P < .05, student's t-test). (F) Comparison of expression level and activity of HEK293T cells expressing a combined PA-Cre2.0 construct (KM10), or an identical version (ΔpA) with a mutant polyadenylation signal. Expression of the Cre fragments is greatly reduced in the ΔpA version. Dark background activity is significantly reduced (*, P < .05), but no significant difference in light-stimulated activity is observed. Graph shows average and error (s.d., n = 3–6 independent experiments). (G) Quantification of Cre recombinase activity with different amounts of wt or L348F CRY2-CreN. All samples contained 1 μg EGFP Cre reporter and 1 μg p645 (CIB1-CreC) and were quantified 48 h post-transfection. Light samples received a 4 h light exposure at 24 h (2 s pulse every 1 min, 461 nm). Samples labeled ‘high’ were transfected with 1 μg of L348F or wt CRY2-CreN; ‘low’ samples contained 50 ng. Graph shows average and range of two independent experiments.

