Figure 2.
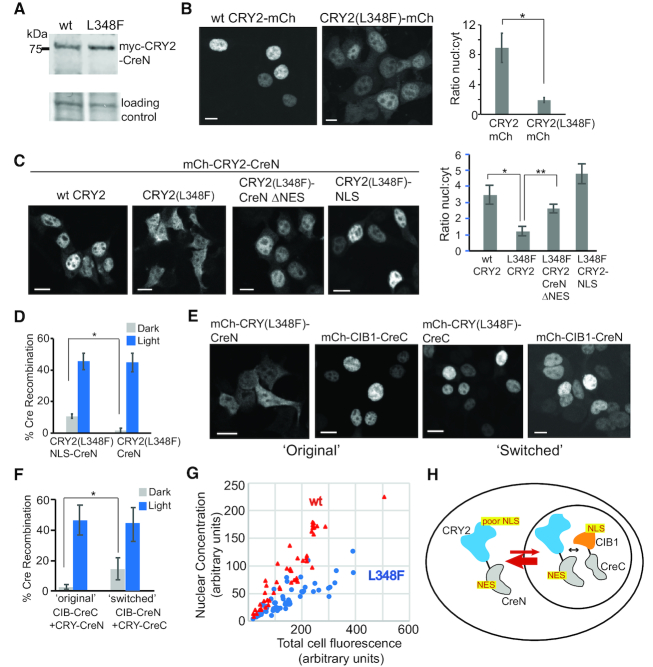
CRY2 L348F mutant shows reduced nuclear localization. (A) Reduced dark activity of CRY2(L348F)-CreN is not due to reduced overall expression. Shown is an immunoblot of cells (anti-myc antibody) expressing myc-tagged versions of wild-type or L348F CRY2-CreN. Loading control, Ponceau S total protein reference band. (B) Localization of mCherry-fused versions of CRY2 (wild-type) or CRY2 L348F. The L348F mutation reduces the percent of expressed protein localized to the nucleus. Graph at right shows quantification of the ratio of nuclear:cytosolic protein (average and error, s.e.m, n = 7 cells; *, P < .05, student's t-test). Scale bars, 10 μm. (C) mCherry-fused versions of L348F CRY2-CreN show even further reduced nuclear localization, compared to wt. Mutation of a putative ‘NES’ in CreN (CreN ΔNES) or addition of an extra NLS (far right, CRY2-L348F-NLS) restores nuclear localization. Graph at right shows quantification of nuclear:cytosolic protein (average and error, s.e.m., n = 7 cells (10 cells for ΔNES); *, P < .05, student's t-test). Scale bars, 10 μm. (D) Quantification of Cre recombinase activity. Addition of an extra NLS (to generate CRY2(L348F)-NLS-CreN) results in enhanced dark activity, with minimal effects on light activity. Graph represents average and range from two independent experiments. (E) Localization of switched CreN and CreC versions. While CRY2(L348F) combined with CreN shows reduced nuclear localization, switched CRY2(L348F)-CreC shows strong nuclear localization. The CIB1 construct shows strong nuclear localization with either CreC or CreN. Scale bars, 10 μm. (F) Quantification of Cre recombinase activity in cells expressing CRY2(L348F)-CreN/CIB1-CreC (‘original’) or CRY2(L348F)-CreC/CIB1-CreN (‘switched’) versions of PA-Cre. Both mCherry-fused and non-fused versions of CIB1-CreN were assayed and results combined. Data represents average and error (s.d., n = 4–6 independent experiments; P < .05, student's t-test). (G) Quantification of nuclear fluorescence relative to total cell fluorescence. HEK293T cells were transfected with increasing amounts of wt or L348F mCh-CRY2-CreN. The concentration of mCherry fluorescent signal in the nucleus, relative to total protein abundance, was quantified. Each dot represents an individual cell, arbitrary units. Red triangles, wt; blue circles, L348F. At all concentrations, wt expressing cells show higher nuclear signal compared with L348F. (H) Model of CRY2(L348F)-CreN nuclear trafficking. The CreN fragment contains a sequence recognized as a NES, while the L348F mutation appears to impair CRY2 nuclear localization. Together this results in a protein with reduced nuclear occupancy.

