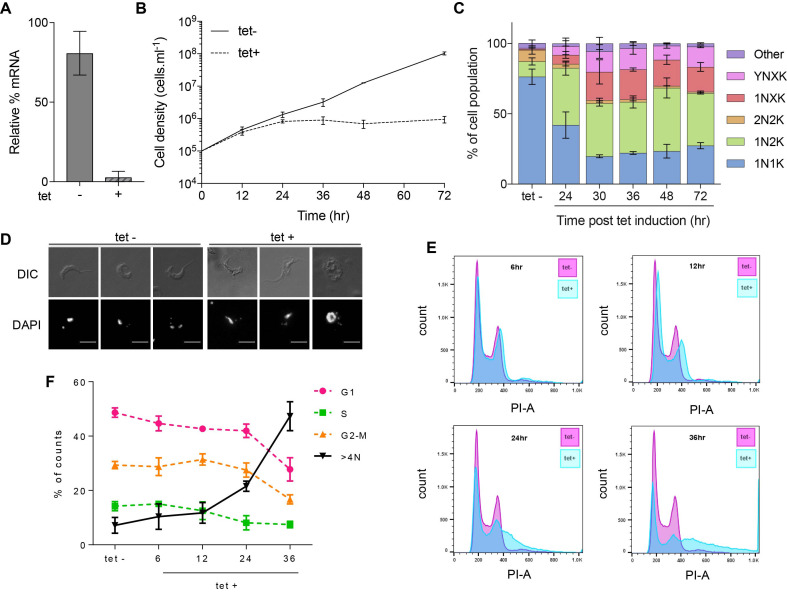
Figure 1.
RNase H2A is essential for bloodstream form T. brucei viability. (A) Levels of TbRH2A transcripts in tetracycline (tet) induced (+) and uninduced (–) cells after 36 h of culture, relative to 2T1 cells (levels set at 100%), determined by RT-qPCR; error bars show SD of two independent experiments. (B) Cumulative growth curves of tet+ and tet- TbRH2A RNAi cultures, showing cell densities over 72 h (uninduced cells were diluted at 24 and 48 h). (C) Bar graph showing, at multiple time points, the percentage of tet-induced cells in the population that correspond to the following cell types, defined by DAPI staining of the nucleus (N) and kinetoplast (K): 1N1K, 1N2K, 2N2K, 1NXK (>2 K foci), YNXK (>2 K foci and aberrant N number or morphology), and other (do not conform to the above). Tet- shows the average of uninduced samples from all time-points. >200 cells were examined at each time point and error bars depict SD from three independent experiments. (D) Example images of induced (tet+) and un-induced (tet–) cells after 30 h of growth; scale bar, 5 μm. (E) Profiles of propidium iodide (PI) stained uninduced (tet–, pink) and RNAi induced (tet+, blue) populations after 6, 12, 24 and 36 h growth; y-axes show cell counts, and x-axes shows PI-area fluorescence. (F) Graph showing the percentage of cells in each expected cell cycle stage (G1, S and G2-M), or cells with genome content >4N, based on measuring proportion of the population with 2N, 2N-4N, 4N and >4N content; tet– shows the average of all tet– time points. In (B), (C) and (F), error bars show SD of three independent experiments.

