Figure 2.
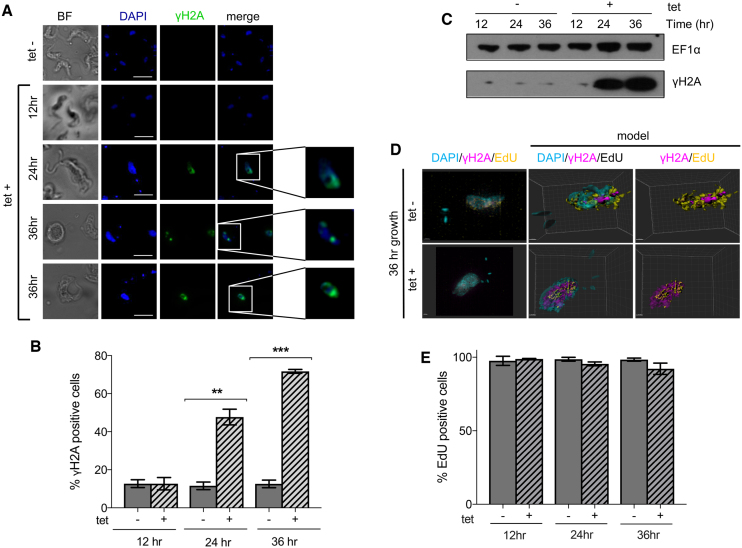
TbRH2A-depleted parasites accumulate DNA damage yet continue to synthesise DNA. (A) High-resolution imaging of DAPI (blue) and γH2A (green) immunofluorescence with (tet+) and without (tet–) RNAi induction, at various time points; scale bar, 5 μm. Images to the right show increased magnification of the boxed nuclear DNA. (B) Bar graphs showing the percentage of tet+ and tet– populations positively staining for γH2A after 12, 24 and 36 h growth; error bars show SD of three independent experiments. (C) Western blot detection of γH2A in whole cell protein extracts after 12, 24 and 36 h growth of tet+ and tet– cells; EF1α staining is shown as a loading control. (D) Example SR-SIM images of DAPI, γH2A and EdU staining are shown, along with 3D reconstructions (model). TbRH2A RNAi cells were cultured in the presence (tet+) or absence (tet–) of tet for 36 h before imaging; scale bar = 1 μm. (E) Bar graph showing the percentage of tet+ and tet– populations positively staining for EdU incorporation after 12, 24 and 36 h of growth; error bars show the SD for three independent experiments (further examples of immunofluorescence images of EdU and γH2A staining are shown in Supplementary Figure S3).

