Figure 5.
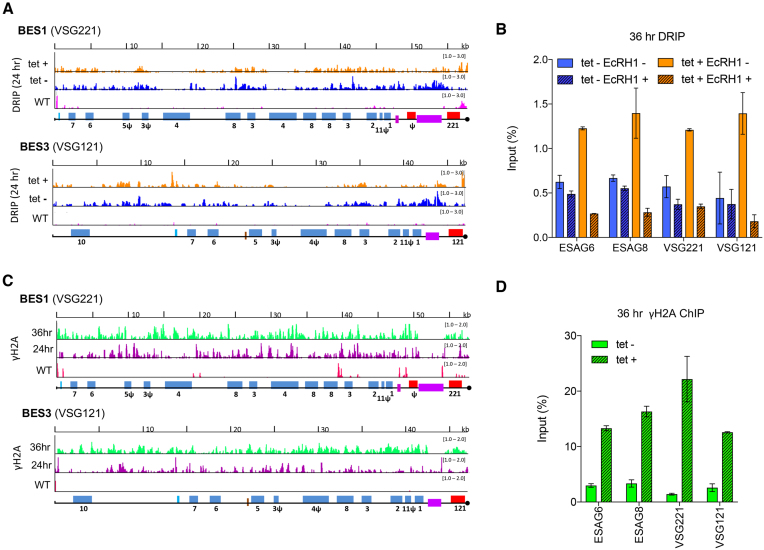
R-loop and yH2A levels increase across VSG BESs in cells depleted of TbRH2A. (A) Localisation of R-loops is shown in BES1 (active site of VSG transcription in WT cells) and BES3 (one normally transcriptionally silent site), comparing DRIP-seq signal in TbRH2A RNAi cells grown for 24 hr in the absence (tet–; blue) or presence (tet+; orange) of RNAi induction, and compared with WT cells (pink). BES features are shown as follows: promoter (aqua), ESAGs (blue, numbered), 70-bp repeats (purple) and VSGs (red); pseudogenes are indicated (ψ), and the end of the available BES sequence is denoted by a black circle. (B) DRIP-qPCR using primers targeting the sequences of ESAG6, ESAG8, VSG221 (BES1) and VSG121 (BES3), with or without E. coli RNase HI (EcRHI) treatment, showing the percentage of amplification in the IP sample relative to input from tet induced (tet+) and uninduced (tet–) cells grown for 36 h. Error bars display SEM for three replicates. (C) yH2A ChIP-seq signal enrichment is shown mapped to BES1 and BES3 as a ratio of reads in tet-induced samples relative to uninduced (each first normalized to the cognate input sample) after 24 (purple) and 36 (green) h growth; γH2A ChIP-seq signal (normalised to input) is shown in WT cells for comparison (pink). (D) γH2A ChIP-qPCR, as in (B): data is shown for tet induced (tet+) and uninduced (tet–) cells after 36 hr of growth. Error bars display SD for two replicates.

