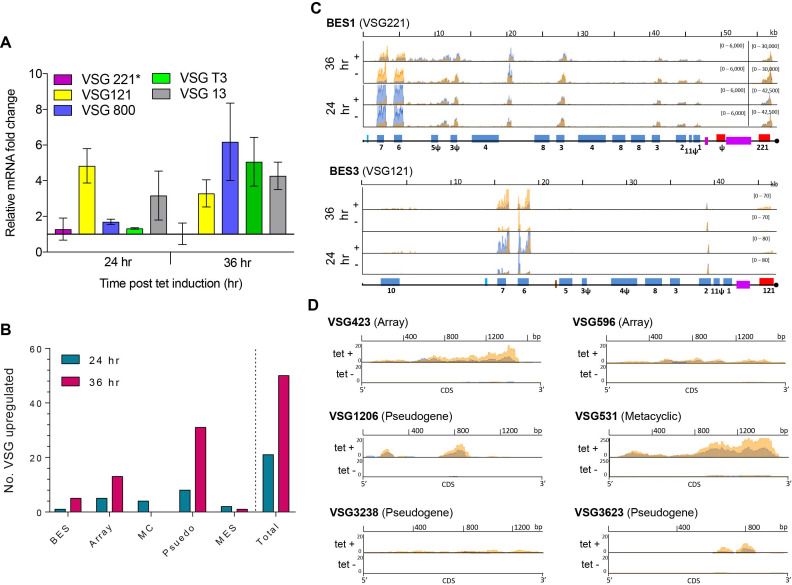
Figure 6.
Depletion of TbRH2A results in increased transcription of silent VSGs. (A) Graph of RNA levels for five VSGs, determined by RT-qPCR, in tet-induced TbRH2A RNAi cells, plotted as fold-change relative to levels of the cognate VSG RNA in uninduced cells after both 24 and 36 h of culture; VSG221 (pink) is in the active BES (BES1) of WT cells, while VSG121 (yellow), VSG800 (blue), VSGT3 (green) and VSG13 (grey) are in silent BESs; error bars show SD for three independent experiments. (B) Graph depicting the number of VSG genes whose RNA levels display significant upregulation in RNAi-induced RNA-seq samples relative to uninduced, both 24 and 36 h after growth; the total number is sub-categorised depending on whether the VSGs have been localized to the BES, are intact genes in the subtelomeric arrays (array), are in minichromosomes (MC), are pseudogenes (pseudo), or are in a metacyclic VSG ES (MES). (C) Normalized RNA-seq read depth abundance (y-axes) is plotted for two independent replicates (overlaid orange and blue) in TbRH2A RNAi parasites after 24 and 36 hr of growth, with (tet+) or without (tet–) RNAi induction. Read depth is shown relative to gene position (x-axes) for BES1 and BES3. (D) As in (C), showing RNA-seq read depth abundance (y-axes) across a selection of non-BES VSG CDS (x-axes), after 36 h of growth.

