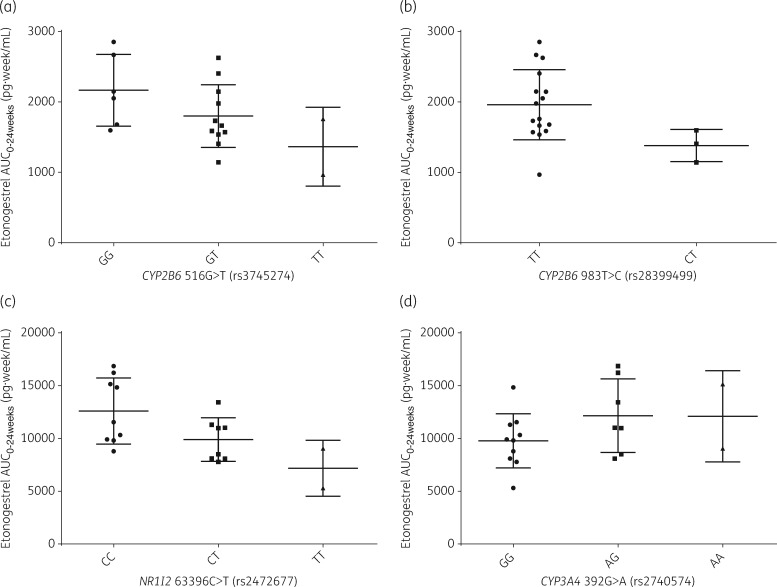
Figure 1.
Etonogestrel pharmacokinetics compared by statistically significant genotype within the efavirenz (a and b) and nevirapine (c and d) groups. Data are represented by mean (SD) and compared by genotype for each of the SNPs significantly associated with etonogestrel AUC0–24weeks found through multivariate analysis (P = 0.05) within the efavirenz group (a and b) and the nevirapine group (c and d).

