Figure 4.
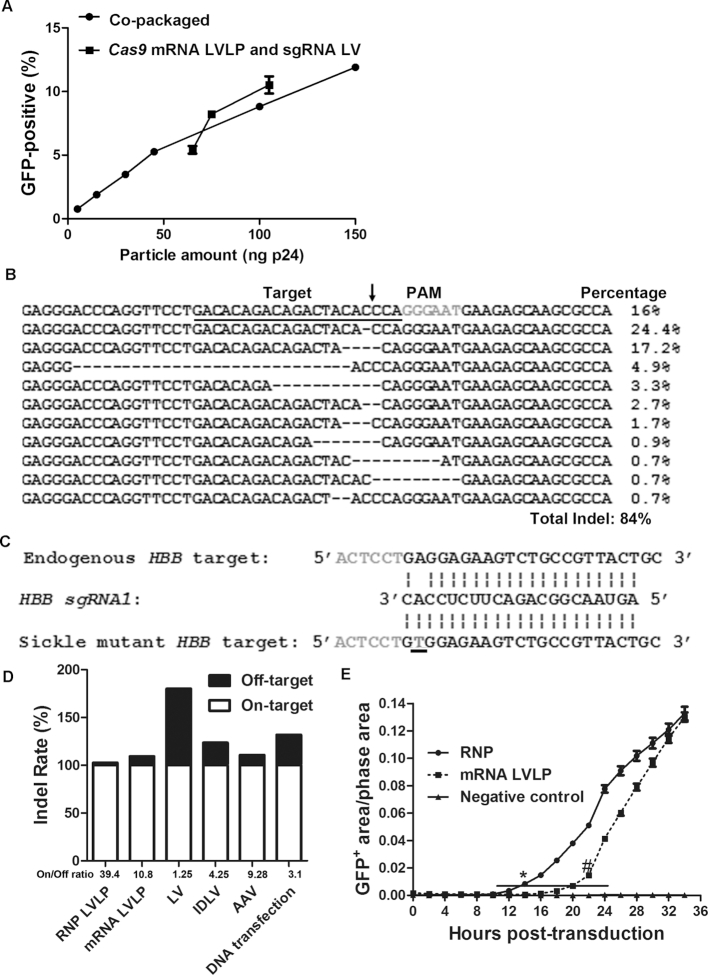
Cas9/sgRNA RNP LVLPs are efficient and specific in gene editing. (A) Cas9/sgRNA RNP LVLPs showed comparable gene editing activity as Cas9 mRNA LVLPs on HBB SCD mutant sequence. For Cas9 mRNA LVLPs, the particle amount was the sum of Cas9 mRNA LVLPs and 60 ng p24 of HBB sgRNA1-expressing LVs. (B) Indels generated by Cas9/IL2RG sgRNA1 RNP LVLPs on the endogenous IL2RG target sequence of HEK293T cells. The protospacer adjacent motif (PAM) is in gray and the target sequence is underlined. The predicted cleavage site is indicated by an arrow. The dashed lines indicate deletions. (C) Diagram showing the sequence of HBB sgRNA1, the Sickle mutant sequence perfectly matching the gRNA, and the endogenous HBB sequence with one mismatch with the gRNA. The mutation causing Sickle cell disease is underlined. (D) Comparison of on target and off-target Indel rate of Cas9/HBB sgRNA1 RNP LVLPs with those of other delivery vehicles. The on-target to off-target Indel rate ratios (‘on/off’ ratios) are the results of on-target Indel rates divided by off-target Indel rates. Cells were harvested 72 h after treatment. For cells grown in 24-well plates, 1.25 × 10⁵ and 2.5 × 10⁴ cells were used for transfection and transduction, respectively. For RNP LVLPs, 55 ng p24 were used; for mRNA LVLPs, 45 ng p24 of Cas9 mRNA LVLPs and 60 ng p24 of HBB sgRNA1-expressing IDLV were used; for LV co-expressing Cas9 and HBB sgRNA1, 30 ng p24 were used; for IDLV co-expressing Cas9 and HBB sgRNA1, 30 ng p24 were used; for Cas9-expressing AAV6 and HBB sgRNA1-expressing AAV6, 104 virus genome/cell were used for each virus. On-target Indel rates are all normalized to 100 for comparison. Original data are in Supplementary Table S3. (E) Cas9 RNP LVLPs showed faster actions than Cas9 mRNA LVLPs. About 50 ng p24 of Cas9/IL2RG sgRNA1 RNP LVLPs, or 100 ng p24 of Cas9 mRNA LVLPs plus 100 ng p24 of IDLV expressing IL2RG sgRNA1 were transduced into 2.5 × 10⁴ GFP reporter cells and incubated in IncuCyte for scanning. * indicates the time point from which RNP-treated cells showed significantly higher GFP-positive area/phase area than negative control or mRNA LVLP-treated cells (P < 0.05). # indicates the time point from which mRNA LVLP-treated cells showed significantly higher GFP-positive area/phase area than negative control cells (P < 0.05). The line shows the time lag in Cas9 mRNA LVLP treated cells to reach the same level of GFP-positive area/phase area as RNP-treated cells.

