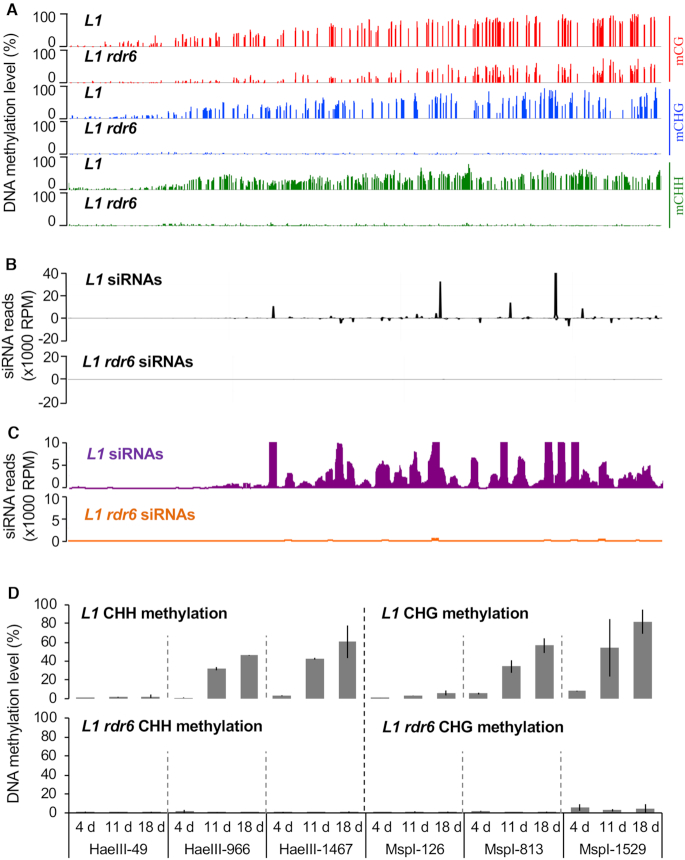
Figure 1.
PTGS-induced DNA methylation is established de novo in each generation. (A) Average DNA methylation levels at CG, CHG and CHH sites of the GUS coding sequence in leaves of 8-week-old L1 and L1 rdr6plants grown under short day conditions. The methylation levels correspond to the ratios of methylated cytosines over the total number of cytosines based on WGBS. The screenshots were obtained with the Integrative Genome Browser (IGB). (B) Distribution of GUS siRNAs in L1 and L1 rdr6 plants. The graphic represents the normalized aligned reads per million, and is based on previously published data (10). (C) Close-up of data in (B), except only showing the distribution of siRNAs that were less abundant than 10000 RPM. (D) Time course of DNA methylation in L1 and L1 rdr6plants using representative CHH and CHG methylation-sensitive enzymes in the 5′, central and 3′ regions of the GUS coding sequence. Plants were sown in vitroand the aerial part was harvested 4, 11 or 18 DAG. Analyses were performed at the following sites: HaeIII-49, MspI-126, MspI-813, HaeIII-966, HaeIII-1467, MspI-1529 (see Supplementary Figure S2). The percentage of DNA methylation at each site is based on the difference in qPCR amplification between digested and mock template. Mean and standard deviation bars are based on two biological replicates.

