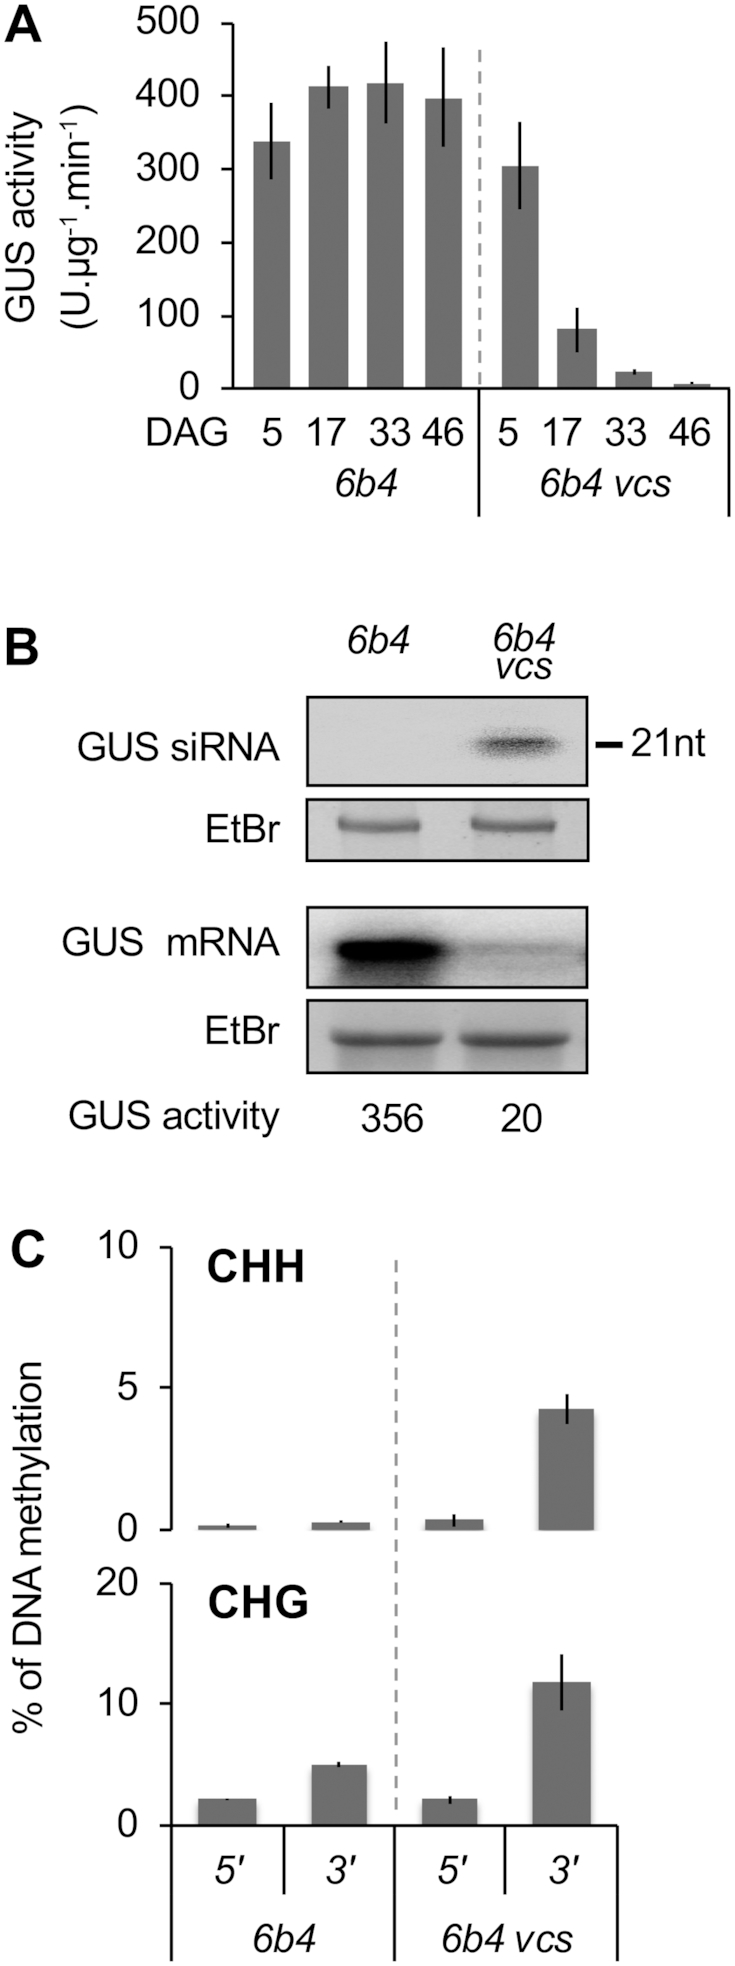
Figure 2.

The pattern of PTGS-induced DNA methylation is locus-independent. (A) Time course of S-PTGS in plants of the indicated genotypes grown under long day conditions. GUS activity was measured in leaves of 16 plants, and is expressed in fluorescent units per minute per microgram of total proteins. Error bars: standard deviation. (B) GUS siRNA and mRNA accumulation in 17-day-old plants of the indicated genotypes. The ethidium bromide signal is shown as loading control. (C) Percentage of DNA methylation at representative CHH and CHG methylation-sensitive enzymes of the 5′ and 3′ regions of the GUS coding sequence in leaves of 17-day-old plants of the indicated genotypes. Analyses were performed at HaeIII-49, MspI-126, HaeIII-1467 and MspI-1529 (see Supplementary Figure S2). The percentage of DNA methylation was calculated as described in Figure 1D. Mean and standard deviation bars are based on two biological replicates.
