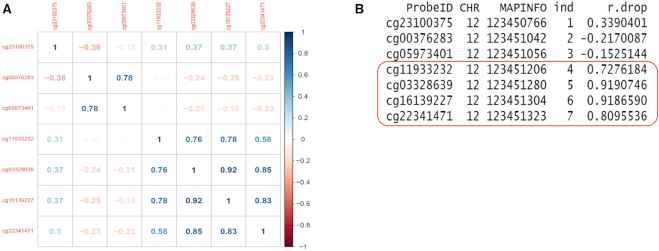
Figure 2.
An example of a contiguous co-methylated sub-region. (A) This pre-defined region (a CGI) included seven CpG probes ordered by their location. Shown are correlation between methylation levels in each pair of CpGs. Note that only the last four probes constitute the co-methylated region within this CGI. (B) The CpGs in the co-methylated sub-region can be identified using the rdrop statistic, which is the correlation between each CpG with the sum of methylation levels in all other CpGs. In this example, all the co-methylated CpGs had rdrop statistics >0.5.

