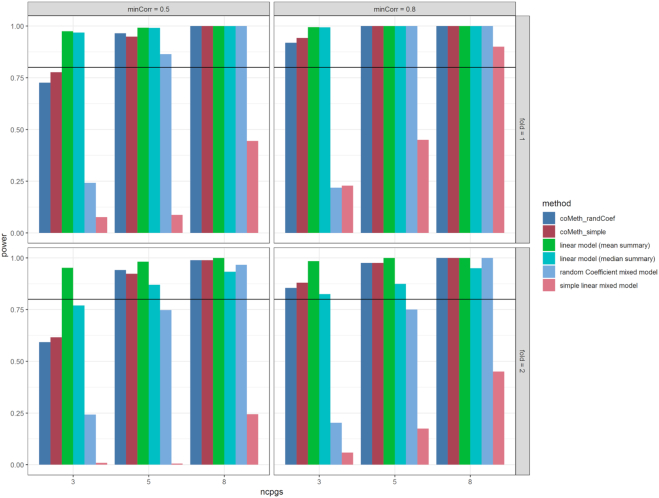
Figure 7.
Power is improved when fitting simple linear mixed model and random coefficient mixed model to co-methylated CpGs in genomic regions (coMeth_randCoef, coMeth_simple), compared to fitting the mixed models to all CpGs in genomic regions. When nCpGs = 3, linear model with mean summary had best power. When nCpGs = 5 or 8, coMeth_randCoef and coMeth_simple had similar power as the linear models. Reference line is at 80% power.

