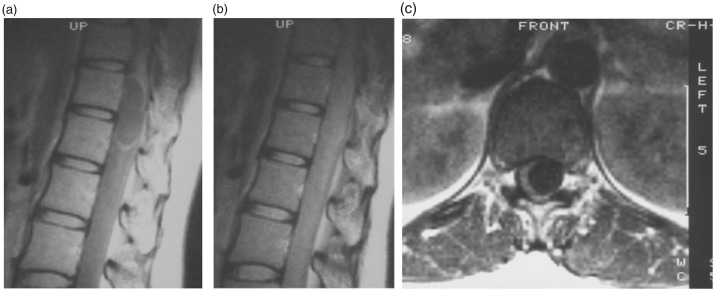
Figure 2.
Proton-density-weighted sagittal thoracic magnetic resonance images [repetition time (TR): 1.60 ms, echo time (TE): 30 ms] obtained 29 years previously showing an intradural mass involving the T12–L1 level. (a) At the periphery of the mass, a region of high signal intensity was detected. At the center of the mass, an area of uniform isointensity was detected. (b) On a T2-like-weighted sagittal section (TR: 1.60 ms, TE: 68 ms), the borders of the mass were unclear and displayed isointensity. (c) On a proton-density-weighted transverse section (TR: 0.50 ms, TE: 30 ms), the spinal cord had been pushed to the right by a mass exhibiting uniform low signal intensity.

