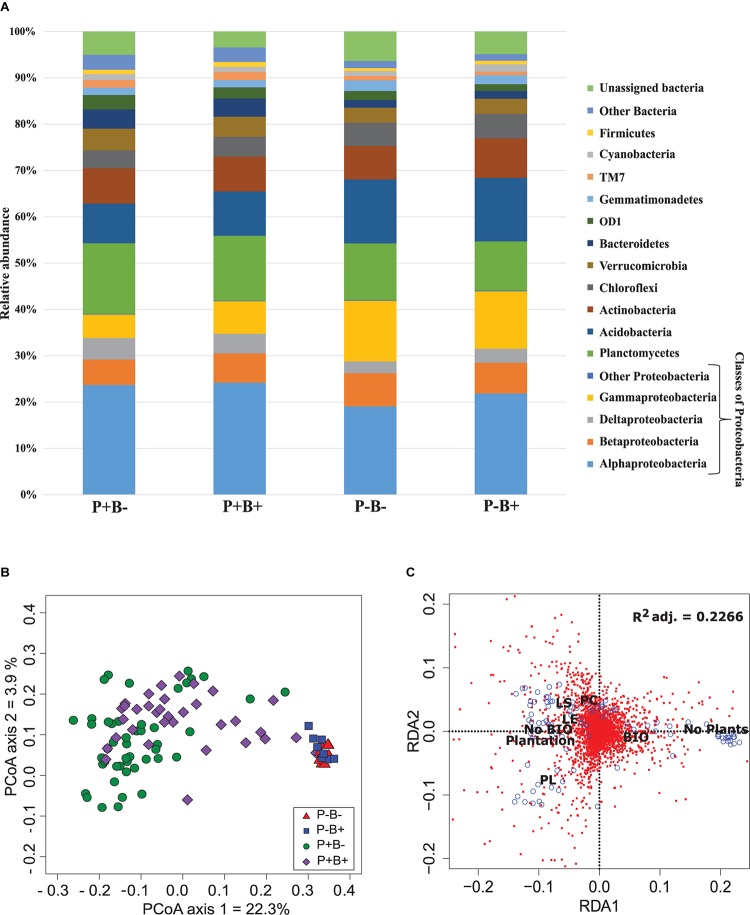
FIGURE 1.
(A) Effect of the plantation and bioaugmentation on the relative abundance of bacterial phyla or classes. (B) Principal coordinate analysis based on the Bray–Curtis dissimilarity of bacterial communities showing the effect of plantation and bioaugmentation. (C) Redundancy analysis (RDA) showing the relation between the abundance of bacterial OTUs and the factors Bioaugmentation, Plantation, and Plant species identity. The adjusted R2 value indicates the amount of variance in bacterial community composition accounted for by the constraining factors (Bioaugmentation, Plantation, and Plant species identity). The location of labels represent factor centroids. Red squares indicate bacterial OTUs. Blue open circles represent individual samples. (Bio, Bioaugmentation; LE, Lycopus europaeus; LS, Lythrum salicaria; PC, Panicum capillare; PL, Persicaria lapathifolia).

