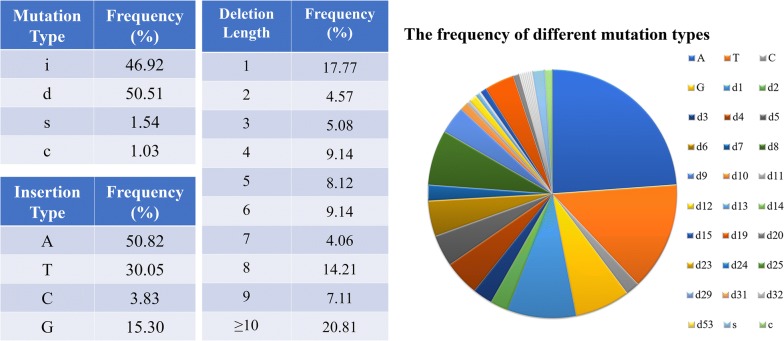
Fig. 4.
Detailed analysis of single-gRNA-mediated mutations in T0 plants. Different mutation types are shown in the left table, while the frequency of different insertion types is shown in the middle table and the frequency of different deletion types are shown in the right table. The pie graph indicates different mutation types of all single-gRNA-mediated mutations

