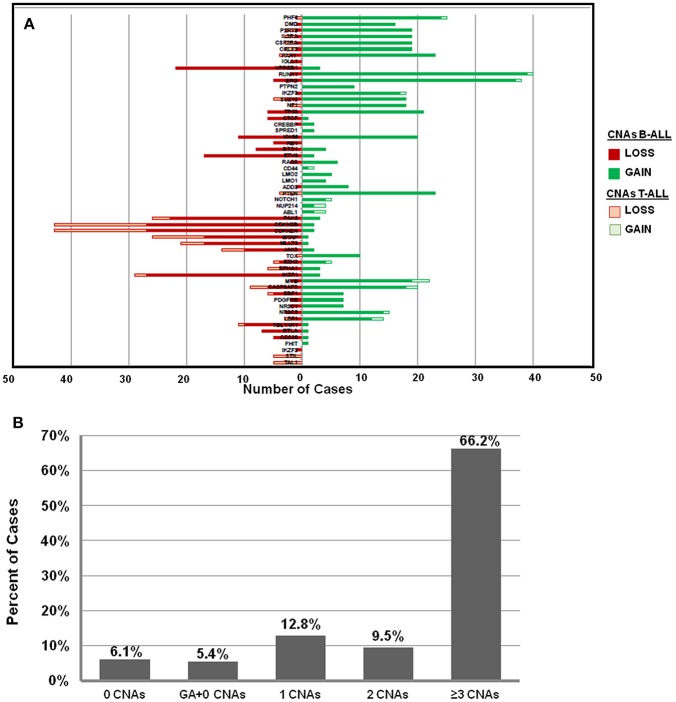
Figure 2.
Frequency distribution of CNAs in ALL cases analyzed by dMLPA. (A) Gene deletions detected in samples of B-ALL (filled red bar) and T-ALL (Empty red bar) are shown in the left panel and gene duplications (filled and empty green bars, respectively) in the right panel. (B) Bar diagram showing percentage of cases with 0, 1, 2, and ≥3 CNAs, GA represents recurrent genetic chromosomal abnormalities.

