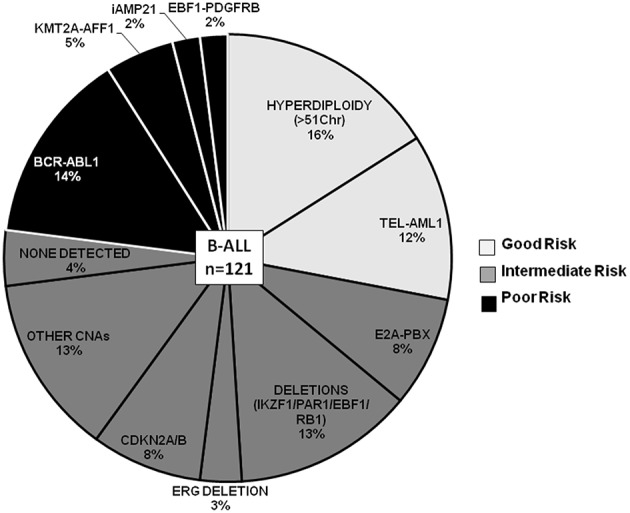
Figure 3.

B-ALL cases categorized by recurrent cytogenetic abnormalities and CNAs. Pie chart depicting the frequency distribution of B-ALL cases with chromosomal abnormalities and CNAs. The various categories are distributed by risk groups and are color-coded as good risk (light gray), intermediate risk (dark gray), and poor risk (black).
