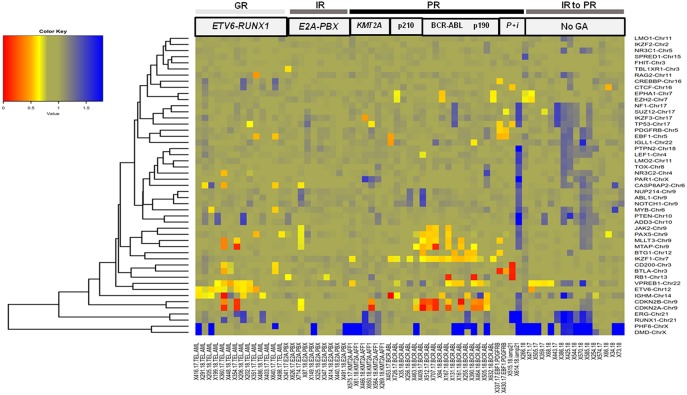
Figure 4.
B-ALL cases categorized by cytogenetic abnormalities showing heterogeneous distribution of CNAs. Heat map showing recurrent chromosomal abnormalities in Good risk (GR) category included ETV6-RUNX1 (hyperdiploidy cases not shown), Intermediate risk (IR) represented by E2A-PBX (samples with IKZF1, EBF1, RB1, ERG, and CDKN2A/B deletions not shown) and Poor risk (PR) included KMT2A-AFF1, BCR-ABL1 (cases with p210 and p190 isoforms), EBF1-PDGFRB (indicated by P), and iAMP21 (indicated by i). Also included in this heat map are CNAs in B-ALL cases with no detectable cytogenetic abnormalities (indicated by No GA). (The color key shows a gradient from red to blue wherein red indicates homozygous deletion, yellow and orange indicate heterozygous deletion and blue indicates duplication. The gene names are labeled on the right hand side and the patient sample IDs with or without genetic abnormality are indicated in the bottom row).

