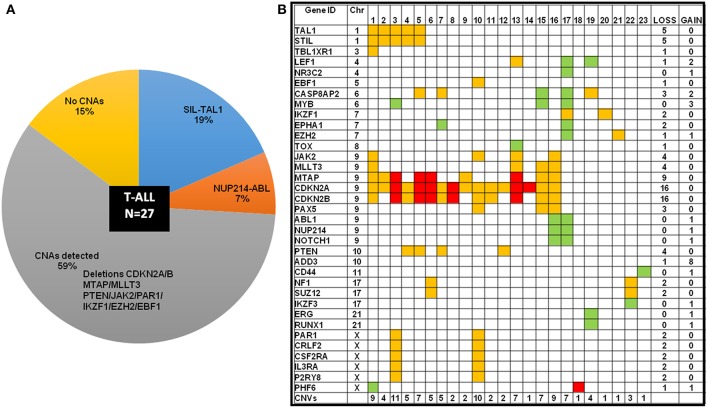
Figure 5.
T-ALL cases categorized by cytogenetic abnormalities showing distribution of CNAs. (A) T-ALL cases sub-categorized by chromosomal abnormalities and CNAs in a pie-chart. (B) Heat map showing the CNAs distribution in T-ALL cases. The color codes indicate red as homozygous deletion, orange indicate heterozygous deletion and green indicates duplication.

