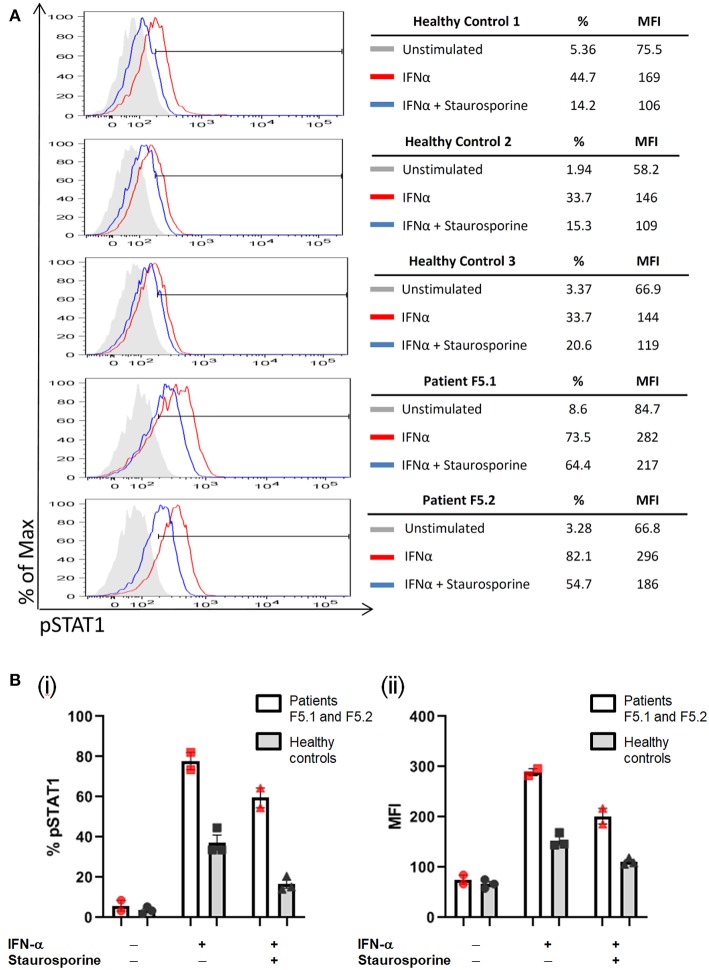
Figure 3.
PBMCs were stimulated with IFN-α (40,000 IU/ml) followed by treatment with staurosporine (500 nM) for 30 min, and analyzed for intracellular pSTAT1 expression by gating on CD3+ T-cells. The increase in %pSTAT1+ population in stimulated cells relative to unstimulated cells was calculated. (A) Representative histograms are shown for Patients F5.1 and F5.2 and 3 healthy controls. (B) %pSTAT1+ T-cells (i) and mean fluorescent intensity (MFI) (ii) in Patients F5.1 and F5.2 compared with 3 healthy controls. Data expressed as mean ± SEM.

