Figure 3.
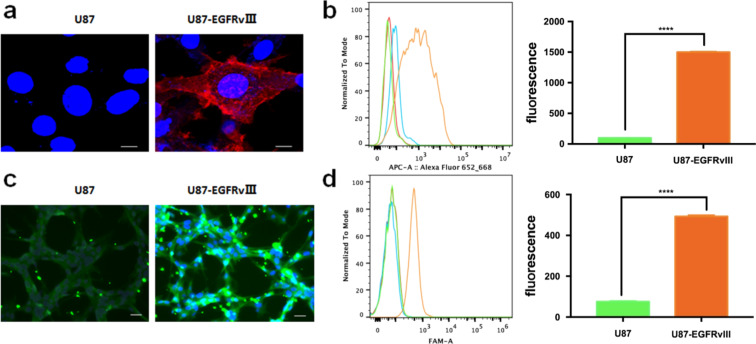
EGFRvIII expression and PEPHC1 binding with U87MG and U87MG-EGFRvIII cells. (a) Fluorescence images of U87MG and U87MG-EGFRvIII cells stained with EGFRvIII antibody. The nuclei were stained in blue and EGFRvIII was stained in red. (b) FACS assay (left) and quantitative analysis of EGFRvIII expression in U87MG and U87MG-EGFRvIII cells. (c) Fluorescence images of U87MG and U87MG-EGFRvIII cells after incubation with 5-FAM-labeled PEPHC1 peptide. The nuclei were stained in blue and PEPHC1 in green. (d) FACS assay (left) and quantitative analysis of PEPHC1 peptide binding to EGFRvIII in U87MG and U87MG-EGFRvIII cells. *** p < 0.0001 compared with U87.

