Figure 5.

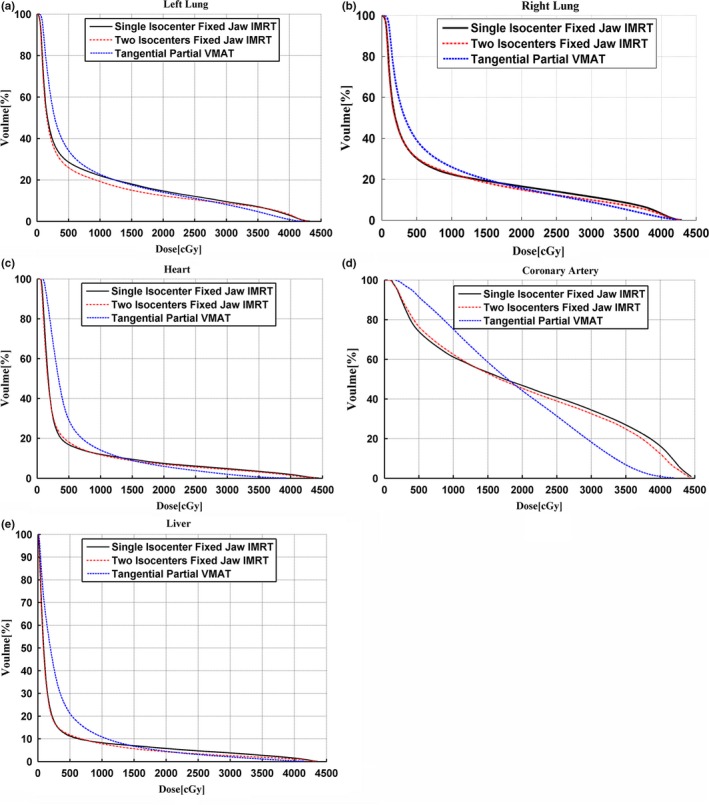
Mean dose‐volume histograms (averaged over the 12 patients) of the left (a) and right (b) lungs, heart (c), coronary artery area (d), and liver (e).

Mean dose‐volume histograms (averaged over the 12 patients) of the left (a) and right (b) lungs, heart (c), coronary artery area (d), and liver (e).