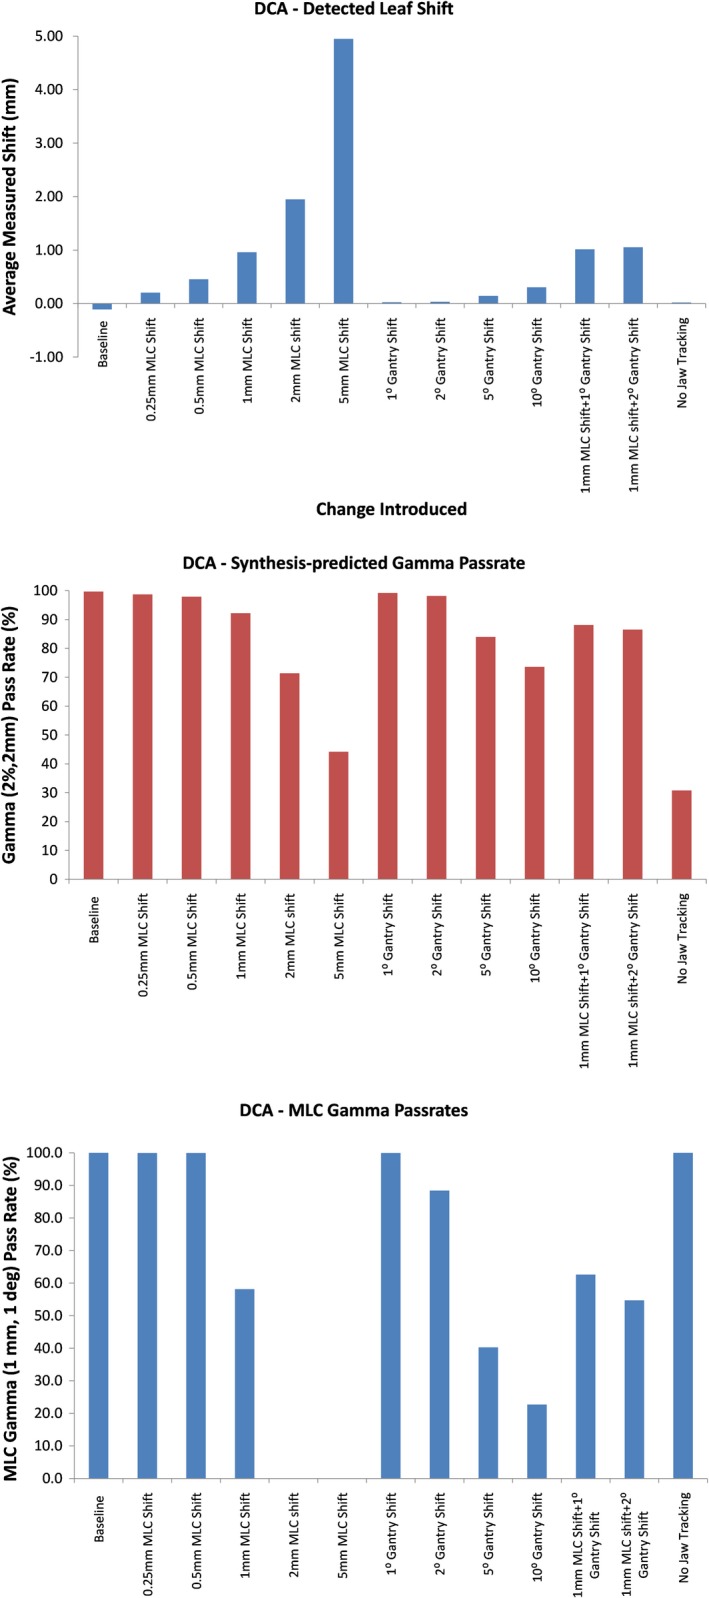
Figure 7.

Measured leaf deviations (top), synthesis‐predicted gamma pass rate (middle), and multileaf collimator (MLC) gamma pass rates (bottom) for all variations of the dynamic conformal arc (DCA) plan evaluated. Note the drop in MLC gamma once the errors introduced exceeded the criteria of 1 mm and 1° used for this metric.
