Figure 4.

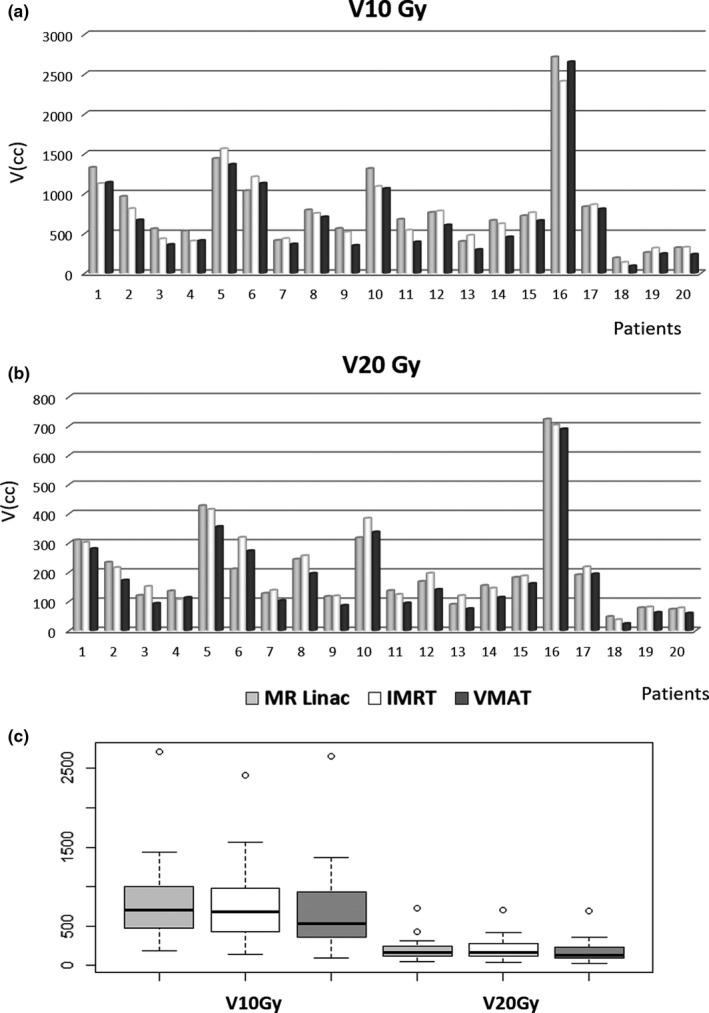
Bar plot (a and b) and box plot (c) showing low dose diffusion expressed as cubic centimeters of V20Gy and V10Gy for IMRT MR‐Linac, IMRT and VMAT and conventional Linac.

Bar plot (a and b) and box plot (c) showing low dose diffusion expressed as cubic centimeters of V20Gy and V10Gy for IMRT MR‐Linac, IMRT and VMAT and conventional Linac.