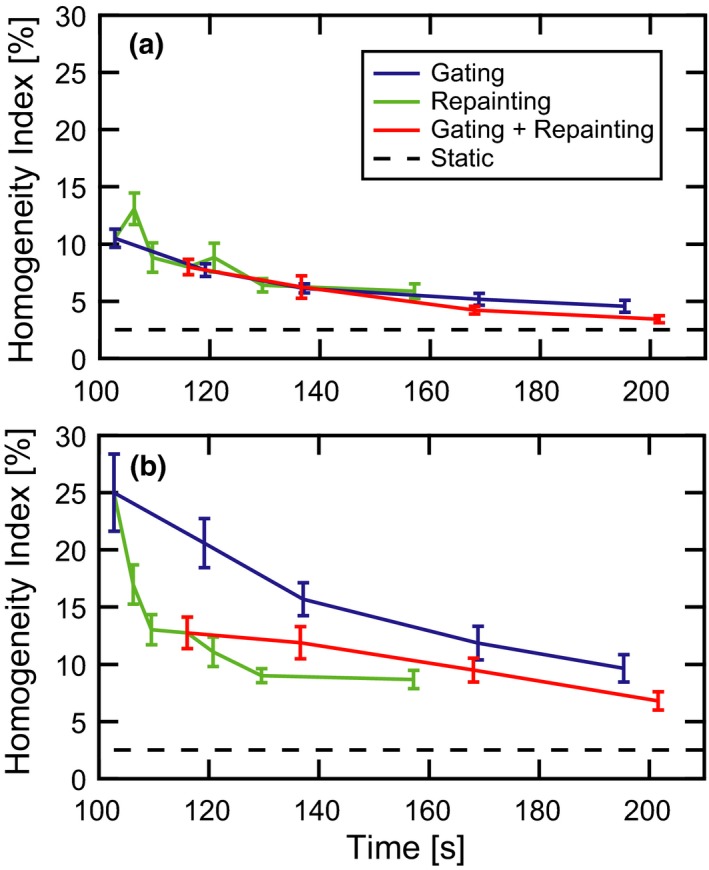
Figure 7.

Homogeneity index vs delivery time. The average CTV homogeneity index (D95% – D5%) and standard error of the mean across 13 distinct motion patterns are plotted against average delivery time. The target moves both (a) parallel to and (b) orthogonal to the primary scanning axis of the proton delivery system in the plane of the beam’s eye view. Curves are shown for the static target (black dashes), gated delivery (blue line), maximum‐MU repainting (green line), and combined gating and maximum‐MU repainting (red). CTV, clinical target volume.
