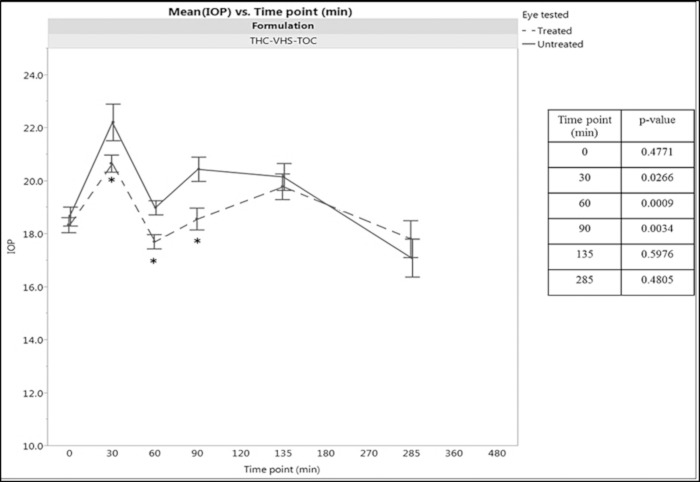
Figure 6.
Mean IOP versus time profile for treated (dotted line) and untreated (solid line) eyes in normotensive rabbits (n = 6) dosed with 50 μL of 0.98% w/v THC-VHS-TOC twice a day for 5 consecutive days. The lines represent the mean of these data points at each time point (± SEM). The IOP profile of the treated versus contralateral rabbit eyes were compared using proc mixed repeated measures model. The P values for treated versus untreated eyes are listed in the figure.

