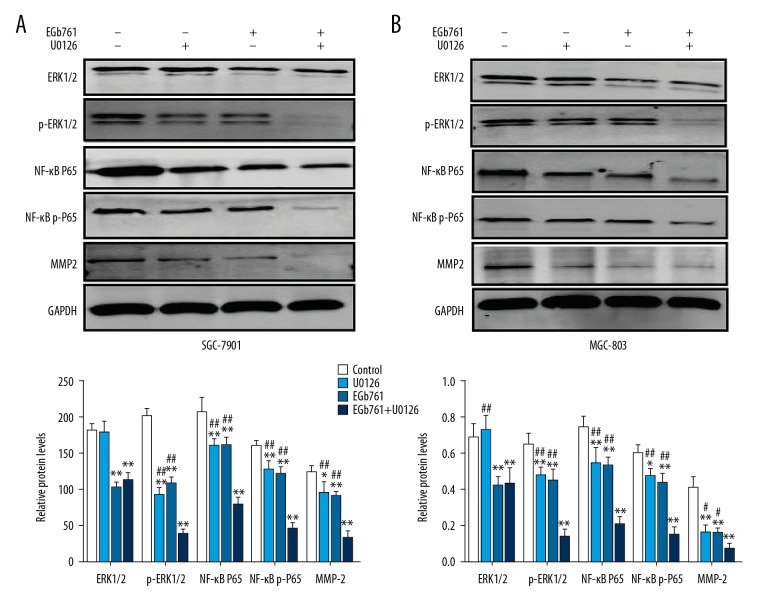
Figure 4.
Effects of EGb761 and (or) U0126 treatments on the protein levels of ERK1/2, p-ERK1/2, NF-κB p65, NF-κB p-p65, and MMP2 in GC SGC-7901 and MGC-803 cells. Cells were pretreated with or without U0126 (10 μM) for 2 h and then treated with EGb761 (400 μg/ml) for 24 h. (A) Representative images of Western blot assay and the quantification of the relative protein expression in SGC-7901 cells. (B) Representative images of Western blot assay and quantification of relative protein expression in MGC-803 cells. N=3, mean ±SD, * P<0.05 or ** P<0.01 vs. control group; ## P<0.01 vs. EGb761+U0126 group.

