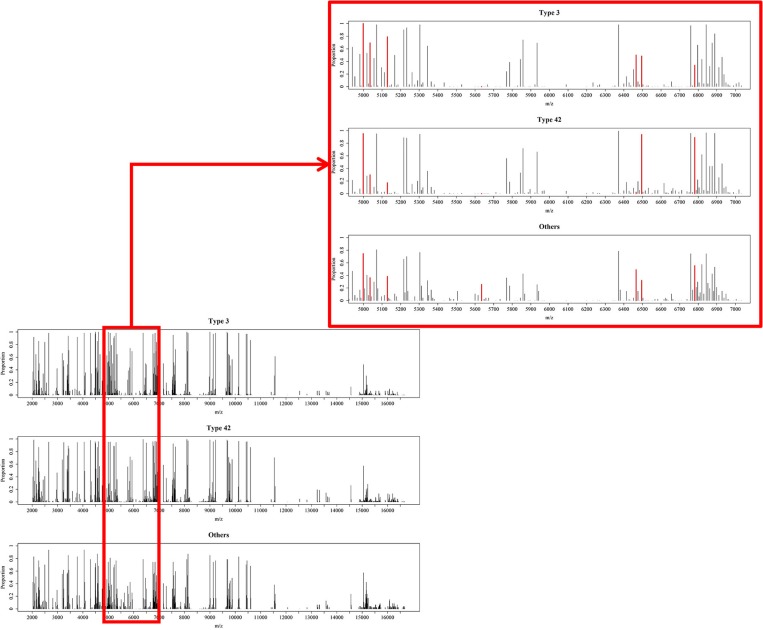
Figure 7.
Overview of processed MS data. Occurrence proportions among the three groups over the range from 2,000 to 17,000 Da and zoomed in for the range 4,900 to 7,100 Da. The red areas include peaks 4548, 4673, 4999, 5036, 5129, 5635, 6466, 6496, and 6781, which are the important peaks when constructing the RF-based classifiers.

