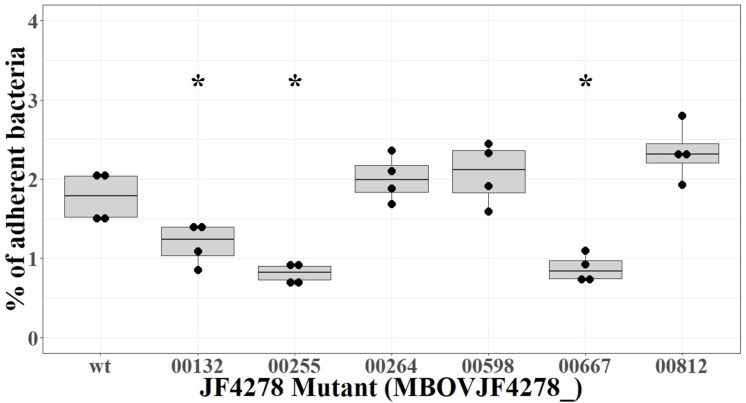
FIGURE 8.
Adhesion assay of individual candidate mutants of M. bovis strain JF4278. M. bovis adhesion to bMec cells after 30 min. The y-axis represents the percentage of adherent M. bovis relative to the added M. bovis. Adhesion with the wild-type strain or single mutants was performed in four independent experiments as indicated by black dots. Median values are indicated as horizontal lines in the box plot. Statistical comparison of each mutant to the wild-type strain was performed by the two-sample Wilcoxon test. ∗P < 0.05.

