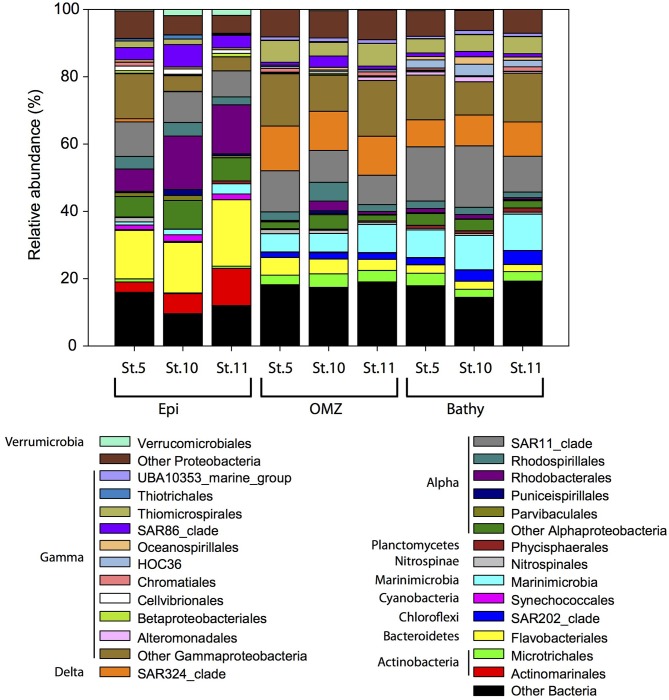
Figure 4.
Relative abundance of major bacterial groups at the order level in specific stations and depth layers based on bacterial 16S rRNA gene sequencing. Orders that contribute ≥1% to the community are shown. Members of orders contributing ≤1% to the community are grouped under “Other Bacteria,” “Other Proteobacteria,” “Other Alphaproteobacteria,” and “Other Gammaproteobacteria.” Epi, epipelagic zone; OMZ, oxygen minimum zone; Bathy, bathypelagic zone; St., station.

