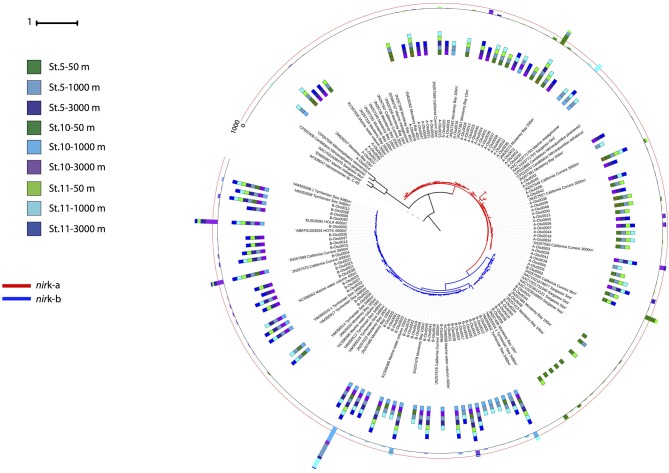
Figure 5.
Phylogenetic tree of the 100 most abundant archaeal nirK OTUs type a and b sampled in the Gulf of Alaska. One representative of sequence group >97% identical is shown; the bar size shows the number of sequences represented by an OTU, and the colors indicate the depth layer. Green tones: epipelagic; light blue tones: oxygen minimum zone; dark blue tones: bathypelagic. Reference sequences as well as environmental sequences from archaeal nirK are included.

