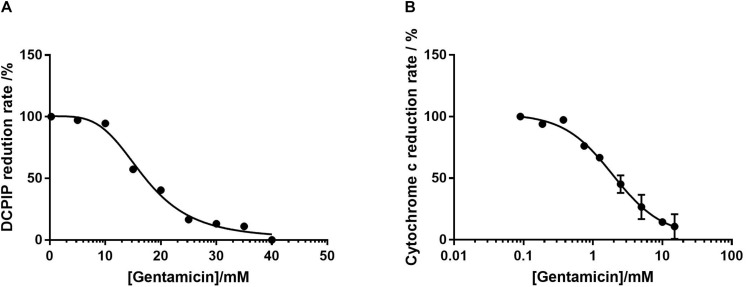
FIGURE 3.
Dose-response curves of isolated mitochondrial protein as a function of gentamicin concentration. (A) Inhibition of complex II in isolation, determined by the decrease in rate of DCPIP reduction at 600 nm, giving an IC50 of 17 mM (95% CI 14.7–21.6 mM, nH 3.8) for gentamicin. (B) Inhibition of complex III, determined by the decrease in cytochrome C reduction at 550 nm rate using ubiquinol-2 as a substrate. The IC50 of gentamicin was determined to be 1.94 mM (95% CI 0.7–1.7 mM, nH 1.2). For both panels N = 3, n = 3.

