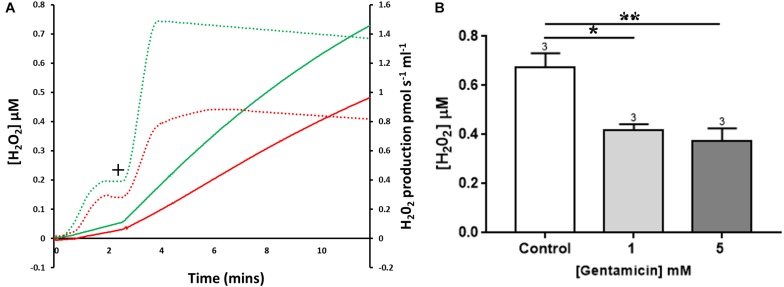
FIGURE 5.
The effect of gentamicin on mitochondrial H2O2 (ROS) production. (A) H2O2 levels detected over a period of 10 min, with the rates of production and overall concentrations plotted. Solid lines display Amplex signal (H2O2 concentration), dotted lines display rates of H2O2 production. Green is control sample, red is pre-treated with gentamicin. Following succinate addition (10 mM) (+), the formation of H2O2 is reduced in samples that were pre-incubated for 10 min with 5 mM gentamicin. (B) Shows quantification of the increase in cumulative H2O2 over a 10 min period, with final concentrations plotted (N = 3, n = 3). Gentamicin reduces endogenous ROS production.

