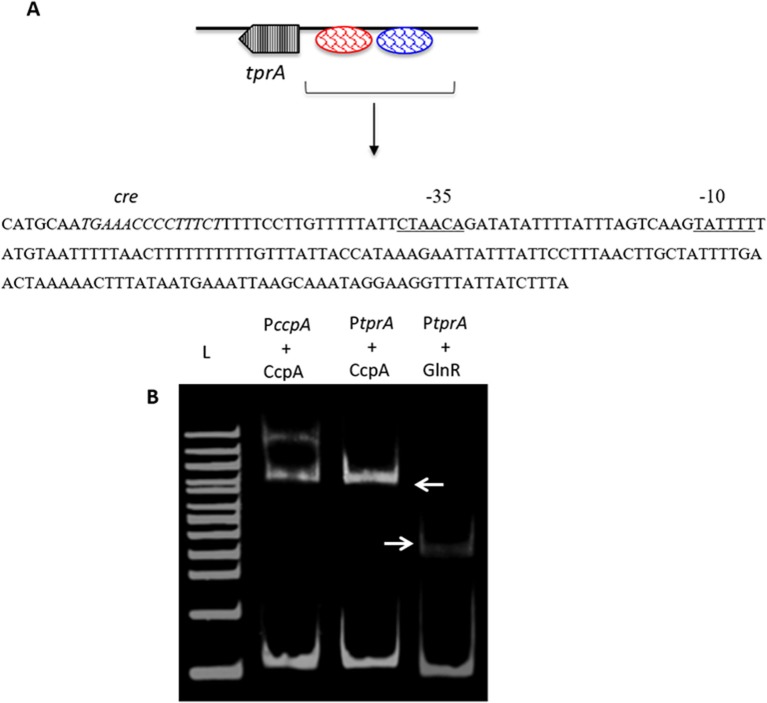
Figure 3.
Electrophoretic mobility shift assay showing the direct interaction of His-CcpA and His-GlnR with the putative promoter region of tprA. (A) Illustration showing the analysis of the predicted promoter region of PtprA used in EMSA. The core promoter regions, −10 and −35 sequences, are underlined, and the putative transcriptional factor binding sites are shown in blue, and the putative cre sequence is in red. (B) Direct interaction of 0.5 μM CcpA and GlnR with the putative promoter sequence of tprA. CcpA binding to its own promoter containing cre sequence was used as a control (lane L- 500 ng of 100 bp DNA ladder (NEB). Gels were stained with SYBR Green EMSA for visualizing DNA. The arrows indicate the mobility shift.

