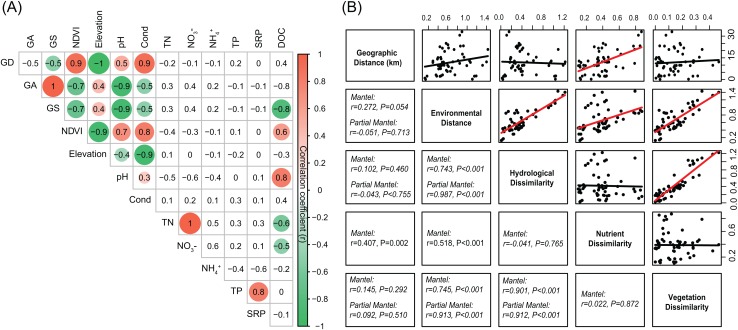
Figure 2. (A) Pairwise-Spearman correlations between environmental variables.
The magnitude of correlation coefficient is only shown graphically with color scale when correlation is significant (P < 0.05). The color intensity and the size of the circle are proportional to the correlation coefficients. (B) Correlations between the different components of environmental dissimilarities. Spearman correlations (r) and associated P-values were calculated by Mantel test. Nutrient dissimilarity was controlled in Partial Mantel test.

