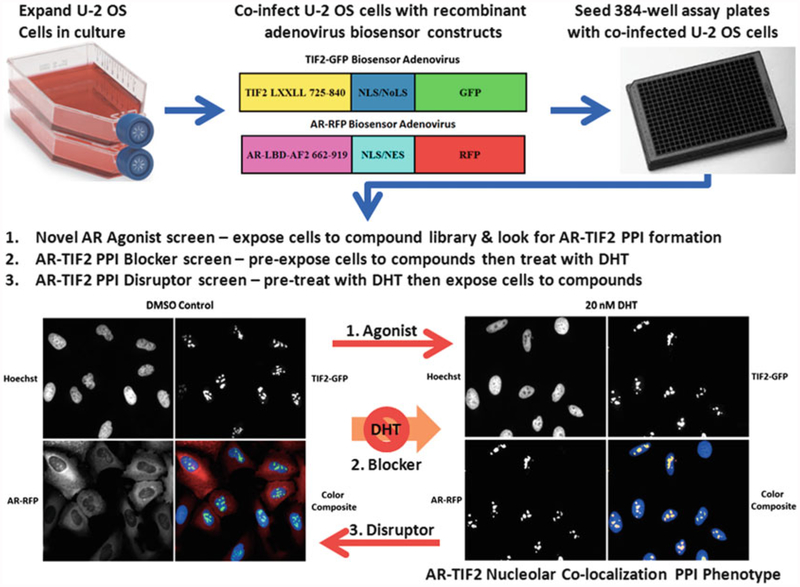
Fig. 1.
AR-TIF2 protein-protein interaction biosensor design, grayscale and color composite images of maximum and minimum plate controls, and potential screening formats. Recombinant adenovirus (rAV) AR and TIF2 biosensor constructs were created to co-infect and express the AR and TIF2 protein-protein interaction partners in cells. The AR-RFP “prey” protein interaction partner shuttles between the cytoplasm and the nucleus in a ligand-dependent manner and the rAV construct is composed of AR residues 662–919 encoding the AR-LBD and AF2 surface as a chimeric fusion protein with red fluorescent protein (RFP) and both nuclear localization and nuclear export sequences that are part of the chimera, and not specific to AR. The central region of TIF2 contains three α-helical LXXLL motifs that mediate the binding to ligand-bound AR, and a rAV construct was created to express TIF2 residues 725–840 as a chimeric fusion protein with green fluorescent protein (GFP) and a high affinity nuclear/nucleolar localization (NLS/NoLS) sequence derived from HIV Rev. The TIF2-GFP “bait” protein interaction partner is targeted to and anchored in the nucleoli within the cell nucleus. U-2 OS cells cultured in tissue culture flasks are harvested after exposure to trypsin, counted, co-infected with the AR-RFP and TIF2-GFP adenoviruses, seeded at 2500 cells per well in 384-well collagen-coated assay plates, cultured overnight at 37 °C, 5% CO2 and 95% humidity, and then treated for 30 min with0.5% DMSO or 20 nM DHT in 0.5% DMSO prior to formaldehyde fixation and Hoechst staining as described above. Individual gray-scale images of three fluorescent channels (Hoechst Ch1 blue, FITC Ch2 green, and Texas Red Ch3) were sequentially acquired on the IXU automated imaging platform using a 20×/0.45 NA objective, the 405 nm Ch1, 488 nm Ch2, and 561 nm Ch3 laser lines, and a Quad emission filter set as described above. Individual× 20 gray-scale and color composite images are presented; Ch1 Hoechst—blue, Ch2 TIF2-GFP—green, and Ch3 AR-RFP—red. In untreated U-2 OS cells expressing both biosensors, AR-RFP expression is localized predominantly to the cytoplasm and TIF2-GFP expression is localized only to nucleoli as indicated by the color composite images of cells with diffuse red cytoplasm and blue nuclei containing bright green TIF2-GFP puncta. After exposure to DHT for 30 min the AR-RFP colocalizes with the TIF2-GFP partner in nucleoli as indicated by the bright yellow AR-TIF2 puncta within the blue stained nuclei of color composite images. The AR-TIF2 biosensor therefore recapitulates the ligand-induced translocation of AR from the cytoplasm to the nucleus, and the PPIs between AR and TIF2 results in the colocalization of ARRFP and TIF2-GFP within the nucleolus. The AR-TIF2 PPIB HCS assay can be screened in three distinct formats: format 1, cells are exposed to compounds to identify novel AR agonists capable of inducing the formation of AR-TIF2 PPIs; format 2, cells are exposed to compounds prior to the addition of DHT to screen for compounds that block DHT-induced formation of AR-TIF2 PPIs; and format 3, cells are pretreated with DHT before compound addition to identify small molecules capable of disrupting pre-existing AR-TIF2 complexes

