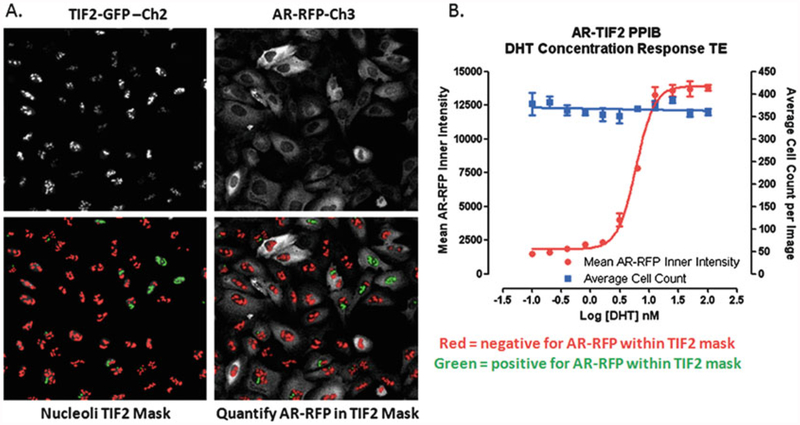
Fig. 2.
Translocation Enhanced Image Analysis Module. (a) Image segmentation-derived TIF2-GFP positive nucleoli masks in the FITC and Texas Red channels. Enlarged and cropped gray-scale images for presentation purposes of TIF2-GFP (Ch2) and AR-RFP (Ch3) from U-2 OS cells co-infected with both biosensor adenoviruses and then cultured overnight without further treatment. The translocation enhanced (TE) image analysis module utilizes the TIF2-GFP biosensor component in Ch2 to create a mask of the nucleoli. The bright fluorescent puncta in Ch2 with TIF2-GFP fluorescent intensities >750 gray levels over background, an approximate width of 4.0 μm, a minimum area of 5.0 μm2, and a maximum area < 150 μm2 are classified by the image segmentation as TIF2-GFP positive nucleoli and used to create translocation masks. AR-RFP images from Ch3 are segmented into nucleoli regions using the masks derived from the detected TIF2-GFP positive nucleoli in Ch2. The red or green color of the nucleoli masks indicates whether the correlation coefficient for colocalization of the AR-RFP signal within the TIF2-GFP positive nucleoli was below (red) or above (green) a preset threshold (typically 0.25). (b) Quantitative data extracted by the Translocation Enhanced image analysis module: average inner fluorescent intensity of the Ch3 AR-RFP signal within Ch2-derived masks of TIF2-GFP positive nucleoli; average cell count per image determined from the number of Hoechst stained nuclei quantified in Ch1 images. U-2 OS cells were co-infected with the AR-RFP and TIF2-GFP rAV biosensors, 2500 cells were seeded into the wells of 384-well assay plates, cultured overnight at 37 °C, 5% CO2 and 95% humidity, and then treated with the indicated concentrations of DHT for 30 min. Cells were then fixed and stained with Hoechst, 20× images in three fluorescent channels were acquired on the IXU automated imaging platform, and the extent of DHT-induced AR-TIF2 PPIs was quantified using the TE image analysis module using the average inner intensity of AR-RFP within TIF2-GFP positive nucleoli parameter. To control for differences in cell numbers, the average number of Hoechst stained nuclei per image was also quantified by the TE image analysis module. The mean ± sd (n = 3) average inner intensity of AR-RFP within the TIF2-GFP positive nucleoli (●) and cell counts per image (■) at DHT concentrations ranging between 0.001 and 100 nM are presented

