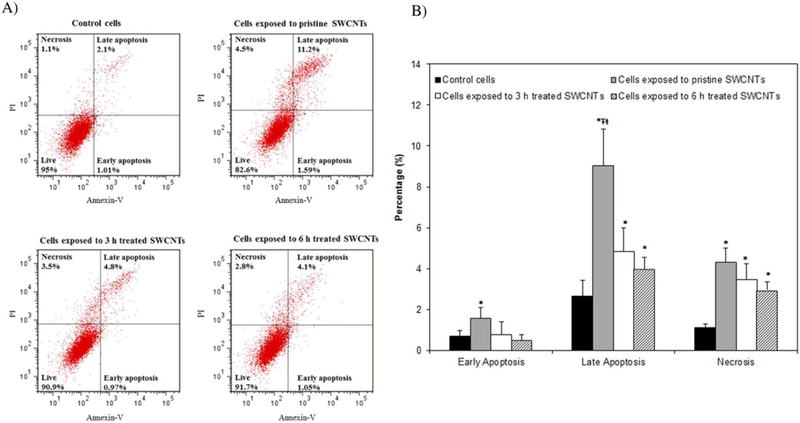
Fig. 2.
Analyses of the cellular viability following exposure to SWCNTs with different physicochemical properties using flow cytometry. A) Histograms of control and SWCNTs exposed cells showing the percentages of cells going through early apoptosis, late apoptosis and necrosis respectively. B) Quantification analyses of cell viability following exposure to SWCNTs with user-tailored properties. (*indicates significant difference relative to control cells, while Ŧ and ŧ indicate significant differences relative to cells exposed to 3 and 6 h treated SWCNTs respectively, all at p* < 0.05).

