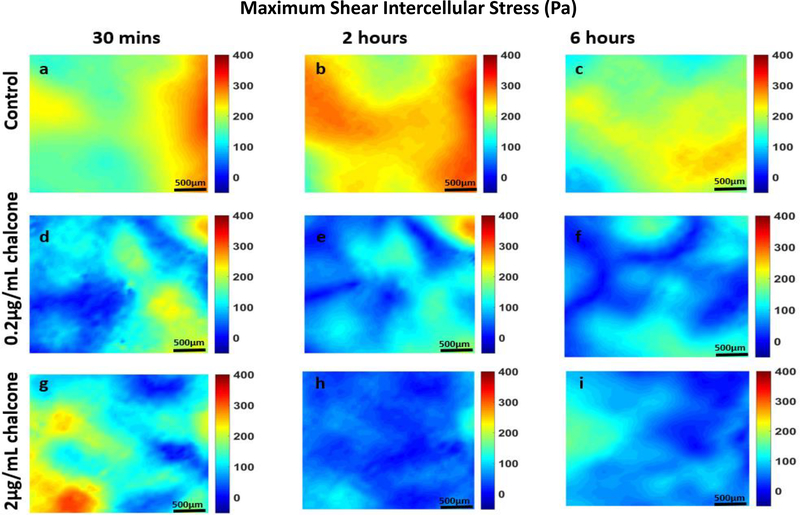
Figure 4:
Maximum shear intercellular stresses (Pa) of HUVEC monolayers during Cx43 inhibition. Figure labels show maximum shear intercellular stresses of HUVECs at 30 mins (a), 2 hours (b) and 6 hours (c) of control HUVECs and at 30 mins (d), 2 hours (e) and 6 hours (f) of HUVECs treated with 0.2μg/mL chalcone and at 30 mins (g), 2 hours (h) and 6 hours (i) of HUVECs treated with 2μg/mL chalcone. Scale bar 500 × 500 μm.

