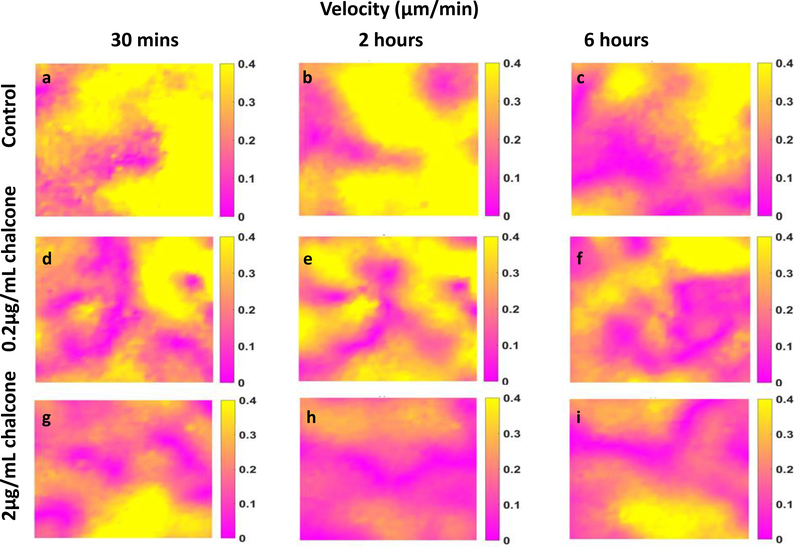
Figure 8:
Velocity in HUVEC monolayers during Cx43 inhibition. Figure labels are as follows—control (a, b and c), 0.2 μg/mL chalcone treated HUVECs (d, e and f) and 2μg/mL chalcone treated HUVECs (g, h and i) are showing velocity distributions at before chalcone treatment (labels a, d and g), after an hour of chalcone treatment (labels b, e and h) and at the end of experiment (labels c, f and i).

