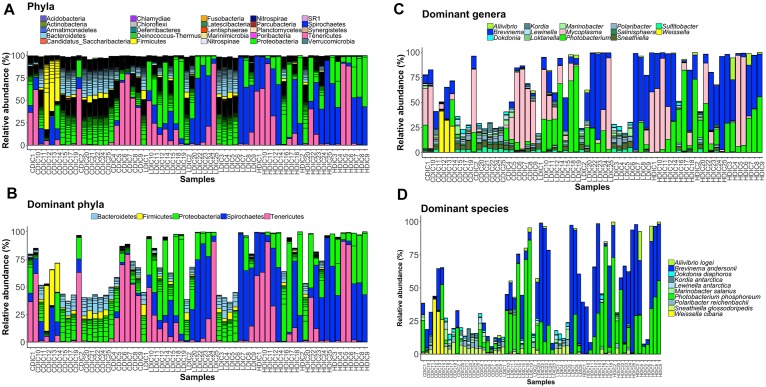
FIGURE 3.
Barplots showing the abundance of the bacterial phyla (A), dominant phyla (B), dominant genera (C) and dominant species (D) in the distal intestinal content. The height of each bar segment represents the abundance of individual operational taxonomic units (OTUs) stacked in order from greatest to least and separated by a thin black border line. Color codes: Proteobacteria – green, Spirochaetes – dark blue, Bacteroidetes – light blue, Firmicutes – yellow, Tenericutes – magenta. Sample names starting with CDIC are control distal intestinal content, LDIC are AlgOS-L-group distal intestinal content and HDIC are AlgOS-H-group distal intestinal content.

