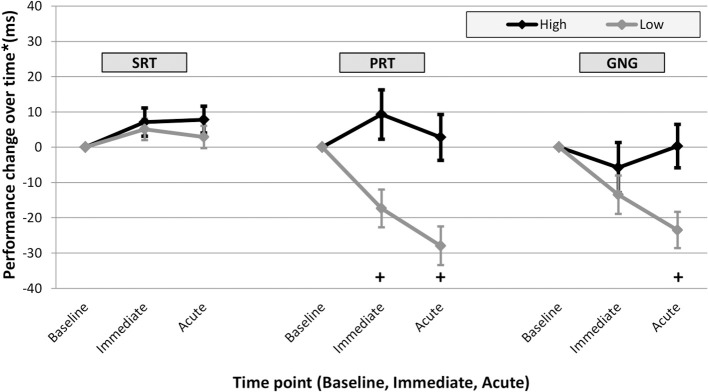
Figure 1.
Adjusted* change score means (and standard error bars) for Immediate and Acute performance by DANA subtest. Change score are plotted over time for participants exposed to >5 psi peak overpressure (“High,” black), and participants exposed to 5 psi or less peak overpressure (“Low,” gray). In both PRT and GNG, the “High” exposure group mean performance change was statistically different from the “Low” group; participants with higher peak overpressure exposure have a reduced level of improvement. Further analyses (regression) resulted in statistically significant differences between “High” and “Low” groups in PRT at the Immediate and Acute time point in PRT and at the Acute time point in GNG as indicated below by “+.” *Mean values estimated from regression using “High” and “Low” peak overpressure exposure groups.

