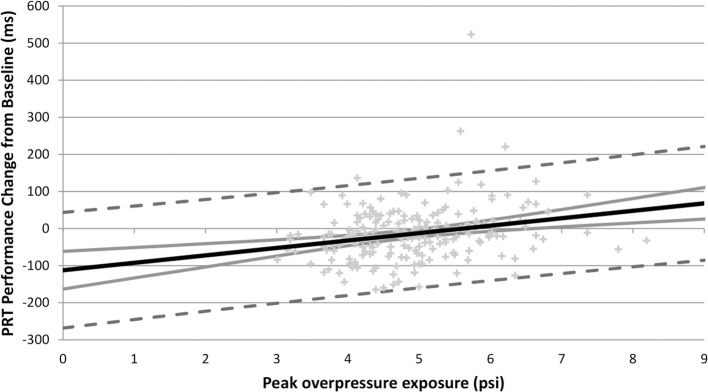
Figure 2.
Peak overpressure exposure (psi) and acute PRT performance change (ms) scatter plot with regression line (black line), confidence interval (gray line), and prediction interval (dotted gray lines). Regression line illustrates association between higher peak overpressure and larger acute PRT performance change scores (indicating slower performance at the end of the training day compared to baseline). The confidence interval marks the boundary which contains the true best fit line with 95% probability. The predication interval shows the range of predicted performance values with corresponding peak overpressure exposure levels with 95% probability. Immediate PRT performance (not pictured) shows a similar trend (i.e., higher peak overpressure associated with larger Immediate PRT performance change scores), but with slightly less gradient.

