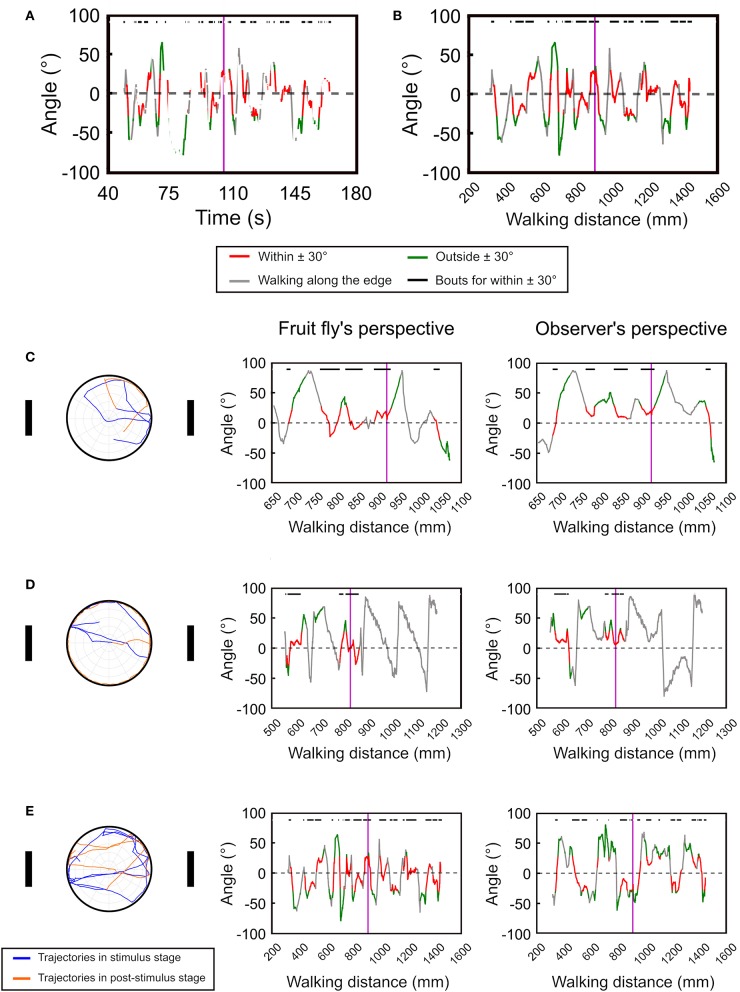
Figure 4.
The temporal deviation angle plot can be improved by plotting the angle as a function of walking distance instead of time. (A) For movement of real flies, plotting the deviation angle as a function of time produces a disconnected curve due to the frequent pauses of the flies. (B) The issue can be resolved by plotting the deviation angle as a function of moving distance. The vertical purple line indicates the offset of the landmarks. The red segments represent the movement bouts that have the deviation angles ≤ ±30° while the green segments are for ≥ ±30°. The gray segments indicate bouts of movement that is along the edge of the platform. The black bars on top of the plots denote the bouts corresponding to the red segment. Using the temporal deviation angle plot, we identify three major types of movement patterns after the landmarks offset. Here we show one example for each pattern. (C) The fly immediately disengages from the fixation behavior after the landmark offset. (D) The fly continues the fixation behavior after the landmark offset, but disengages from the fixation behavior once it reaches the edge of the platform. (E) The fly continues the fixation behavior for a long period of time. The left column shows the moving trajectories while the middle and right column displays the temporal deviation angle plot in the fruit fly's and the observer's perspectives, respectively. In the trajectory plots (left column) the trajectories before and after the landmark offset are represented by the blue and orange curves, respectively.

