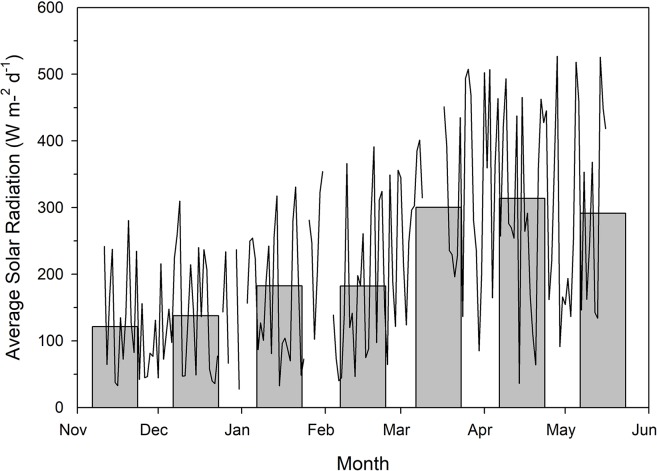
Figure 1.
Total natural solar radiation as measured outside of the greenhouse using a Li-COR LI-200R pyranometer. Measurements were taken every 15 min between the wavelengths of 400–1100 nm throughout the course of the experiment. Measurements during the photoperiod were then averaged to provide average solar radiation readings for each individual day. The line plot represents average daily solar radiation while the bar graphs indicate average daily solar radiation throughout the month. Breaks in the line plot data indicate periods of time which were not documented due to technical malfunction.

