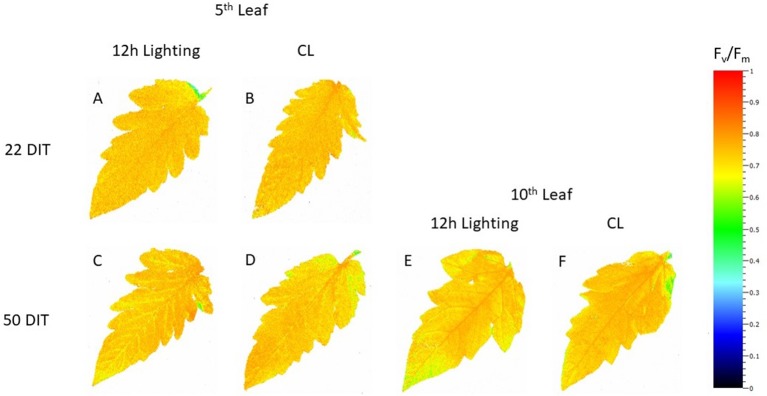
Figure 3.
Spatial response of Fv/Fm from tomato leaves grown under either 12 h lighting (200 µmol m−2 s−1 red + 50 µmol m−2 s−1 blue, 06:00–18:00) and CL (200 µmol m−2 s−1 red, 06:00–18:00 + 50 µmol m−2 s−1 blue, 18:00–06:00) at 22 DIT (A and B) and 50 DIT (C–F). Chlorophyll fluorescence images of the 5th leaf are labelled (A–D) and images of the 10th leaf are labelled (E and F).

