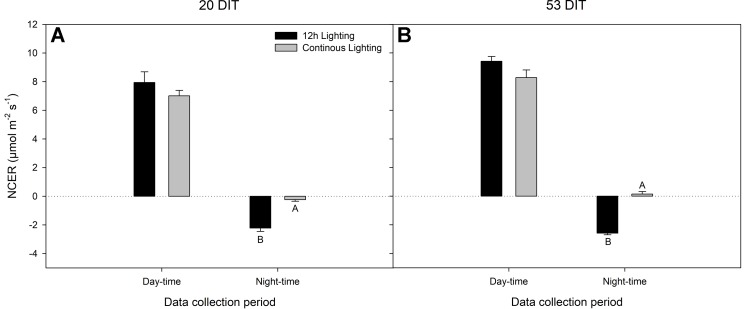
Figure 4.
Net carbon exchange rate (NCER) of the 5th leaf from tomato plants grown under 12 h lighting (200 µmol m−2 s−1 red + 50 µmol m−2 s−1 blue, 06:00–18:00) and CL (200 µmol m−2 s−1 red, 06:00–18:00 + 50 µmol m−2 s−1 blue, 18:00–06:00) at 20 DIT (panel A) and 53 DIT (panel B) during the day-time and night-time. Measurements were performed using a Li-COR 6400 fitted with a clear top chamber on a cloudy day or night and thus represent the NCER driven by the supplemental lighting. Error bars represent the standard error of the mean of n = 4. Letter groups (A, B) represent significant difference between the lighting treatments at a specific data collection period at p < 0.05.

